Figure 5.
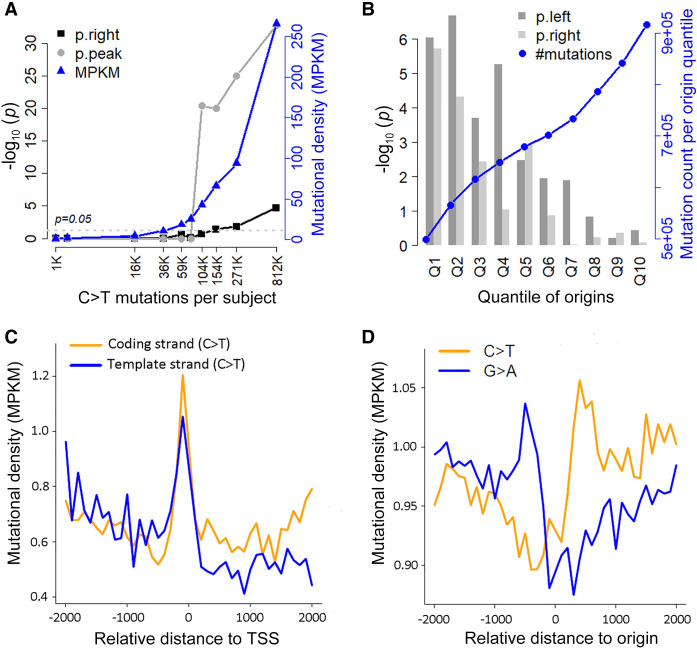
Technical properties of MutDens. (A) Analysis results for C > T mutations from 10 individual MELA-AU samples of increasing mutation burdens. Because the vicinity of TSS was examined, we visualized the transformed P-values out of right-flank Wilcoxon test (p.right) and the Poisson distribution test for central peak (p.peak). (MPKM) Mutations per kilo total mutations per megabase. (B) Analysis results for MELA-AU C > T mutations against 10 equal-sized Origin subsets (Q1–Q10) of decreasing SNS-seq scores. Because replication origins were examined, we visualized the transformed P-values out of both left-flank and right-flank Wilcoxon tests (p.left and p.right). (C) C > T mutations from a single sample in MELA-AU (EXTERN-MELA-20140526-101) led to mutation density curves that clearly reflected transcriptional strand bias. (D) Restricting Origins to the top 10% of highest SNS-seq scores (Q1), the flip of predominant mutational form at Origin center became more apparent, clearly hinting at a replicative strand bias.

