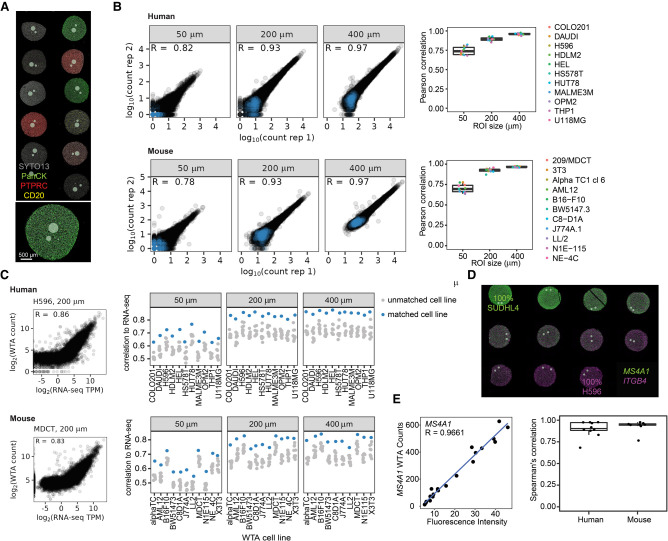
Figure 1.
Human and mouse WTA data are reproducible and correlated with RNA-seq and RNA FISH. (A) Representative image of the areas of illumination (AOI)-size titration experiment. Circular AOIs 50 μm, 200 μm, and 400 μm in diameter were placed on each cell line of an 11-core human or mouse formalin-fixed paraffin embedded (FFPE) cell pellet array (human shown, stained with antibodies against CD3E, PTPRC, and pan-cytokeratin [PanCK], and SYTO13 nuclear stain). (B) Reproducibility of WTA counts from two replicate experiments. Left: Scatterplots of log10-transformed raw counts from one representative human (HUT78) or mouse (3T3) cell line at each AOI size from each replicate. Negative control probes are shown in blue and target probes in black. Right: Pearson correlation coefficients of log10-transformed raw counts between replicates for each cell line and AOI size. (C) Left: Scatterplots of WTA counts versus RNA-seq TPM from the same cell line for one representative human or mouse cell line in a 200 μm AOI. Right: Spearman's correlation of WTA counts compared with RNA-seq of each cell line. For each AOI, the matching cell line is shown in blue and all other cell lines in gray. (D) Representative image of the cell line titration experiment. Cell pellets contained one cell line titrated into the other at a variable ratio. Cells were stained with RNAscope probes against two genes specifically expressed in one of the two cell lines. Gray circles show profiled AOIs. (E) Left: Representative scatterplot comparing WTA counts for MS4A1 to RNAscope fluorescence intensity for the same gene across cell pellets. Right: Spearman's correlation of WTA counts compared with RNA FISH fluorescence intensity for each gene profiled.

