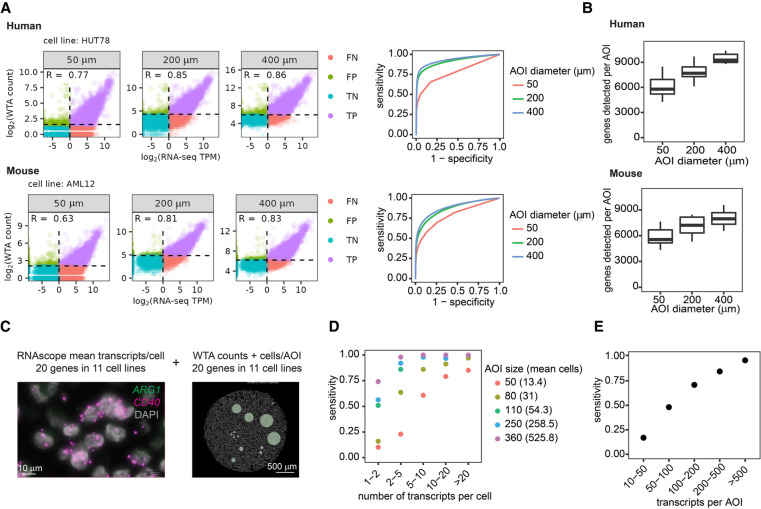
Figure 2.
WTA has high sensitivity and can detect genes at a range of expression levels depending on areas of illumination (AOI) size. (A) Left: Scatterplots comparing WTA counts to RNA-seq for one representative cell line at each AOI size, colored by whether the gene is detected above the expression threshold in each assay. Dashed lines indicate thresholds for calling a gene “expressed” as 2 standard deviations above the geometric mean of negative probes for WTA, and TPM > 1 for RNA-seq. TP, true positive; FP, false positive; TN, true negative; and FN, false negative. Right: Receiver-operator curves demonstrating the sensitivity and specificity of WTA at different WTA expression thresholds. (B) Number of genes per AOI above the expression threshold of 2 standard deviations above the mean negative probe count at each AOI size. (C) Representative images of the experiment to determine the sensitivity of human WTA relative to absolute transcript number. Left: RNAscope image of two genes in one cell line of the 20 genes in 11 cell lines quantified in this experiment. Right: Digital Spatial Profiling (DSP) image of one cell line with an AOI size titration. (D) Sensitivity of WTA at different AOI sizes for genes in different gene expression bins as measured by RNAscope. Genes ≥ 1 transcript per cell were considered expressed. Intervals are open on the left and closed on the right. (E) Sensitivity of WTA for genes binned by transcripts per AOI, calculated using transcripts per cell quantified by RNAscope and the number of cells in each AOI.

