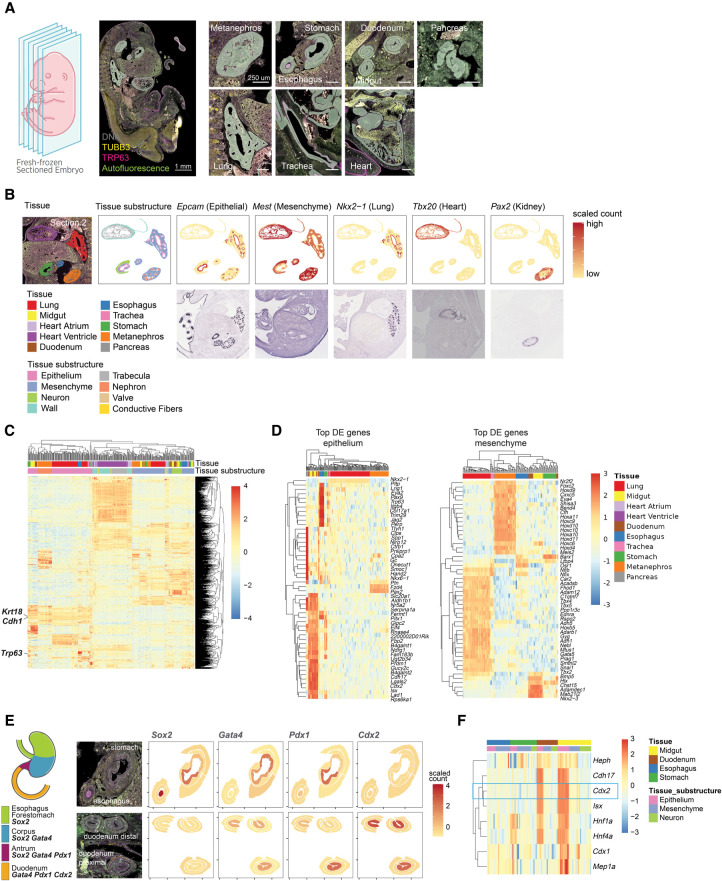
Figure 5.
Spatial profiling of transcriptional programs during organogenesis in a midgestation mouse embryo. (A) Left: Schematic and representative image of the fixed frozen E13.5 mouse embryo profiled. Embryos were labeled with antibodies against TRP63 (magenta) and TUBB3 (yellow). Autofluorescence is shown in green. Right: Example images of each organ profiled showing the areas of illumination (AOI) profiling strategy. Freeform polygon AOIs capture anatomical substructures of each organ. (B) Expression of marker genes for specific organs and cell types in an example section compared with in situ hybridization (ISH) images of the same genes in E14.5 mouse embryos from the GenePaint database (https://gp3.mpg.de/, Diez-Roux et al. 2011; Visel et al. 2004). Tissue, tissue substructure, or normalized scaled WTA count is plotted over the shape of each AOI. (C) Heatmap showing scaled expression of the 2000 most variable genes across the data set. Columns and rows are clustered by hierarchical clustering and columns are annotated by organ and organ substructure. (D) Heatmaps showing scaled expression of the top 50 most differentially expressed genes in epithelium (left) and mesenchyme (right). All genes shown are significant at Bonferroni-corrected P-value < 0.01. Columns and rows are clustered by hierarchical clustering and columns are annotated by organ. (E) Left: Schematic of key transcription factor expression in stomach and gut development (adapted from Willet and Mills 2016). Right: Expression of the same transcription factors plotted on example AOIs from a representative section. (F) Heatmap showing scaled expression of Cdx2 and Cdx2-target genes from Gao et al. (2009) in esophagus, stomach, duodenum, and midgut AOIs. Columns and rows are clustered by hierarchical clustering and columns are annotated by organ and organ substructure.

