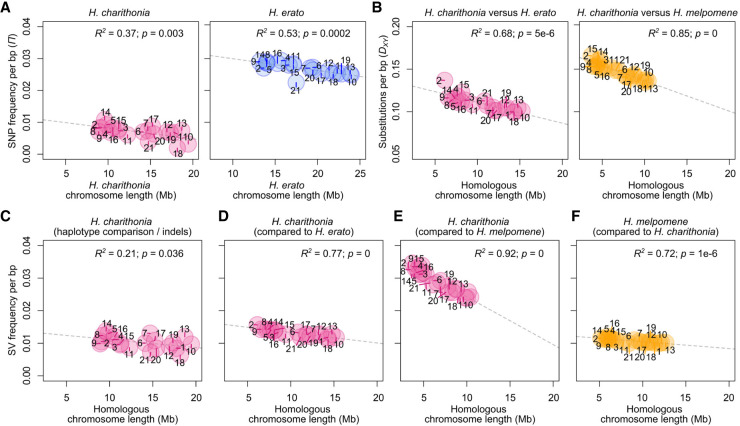
Figure 3.
Patterns of lineage-specific sequence distribution and chromosome lengths. (A) Correlation between chromosome lengths and single nucleotide polymorphism (SNP) frequency (nucleotide diversity, π) for H. charithonia and H. erato. H. charithonia SNPs were obtained by comparing the two genome pseudohaplotypes. The H. erato SNPs were obtained from whole-genome resequence data of ten H. e. demophoon samples from Panama. Note that the higher nucleotide diversity in H. erato likely results from its larger population size. (B) Correlation between chromosome lengths when only considering homologous sequence and substitutions (pairwise nucleotide differences, DXY) averaged for each chromosome between H. charithonia and H. erato and H. melpomene, respectively. DXY was calculated from homologous sequences in the pan-genome. (C) Correlation between homologous chromosome lengths and frequency of indels in the chromosomes of H. charithonia. Correlation between homologous chromosome lengths and frequency of lineage-specific sequences in the chromosomes of (D) H. charithonia compared with H. erato, (E) H. charithonia compared with H. melpomene, and (F) H. melpomene compared with H. charithonia. Dashed lines indicate regression fit. Numbers indicate chromosome numbers. Colors refer to sequences specific to H. charithonia (pink), H. erato (blue), and H. melpomene (orange). See Supplemental Figure S2 for pattern in 1 bp indels, structural variants (SVs) between 2 and 50 bp, SVs larger than 1000 bp, and SVs characterized as TEs.

