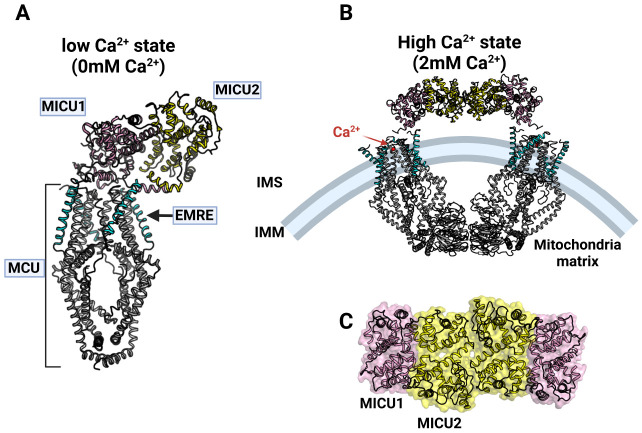
Fig. 4.
Human MCU holo-complex structure. (A) Side view of hMCU holo-complex at low Ca2+ state (0mM experimentally) (56). MCU (gray), EMRE (cyan), MICU1 (pink) and MICU2 (yellow) are colored (PDB code: 6WDN). (B) Side view of hMCU holo-complex at high Ca2+ state (2 mM experimentally, PDB code: 6WDO) (56). Colors shows each component of hMCU holo-complex are described as well as (A). Ca2+ is represented by a red circle. (C) Dimer of MICU1-MICU2 heterodimer in hMCU holo-complex at high Ca2+ state.

