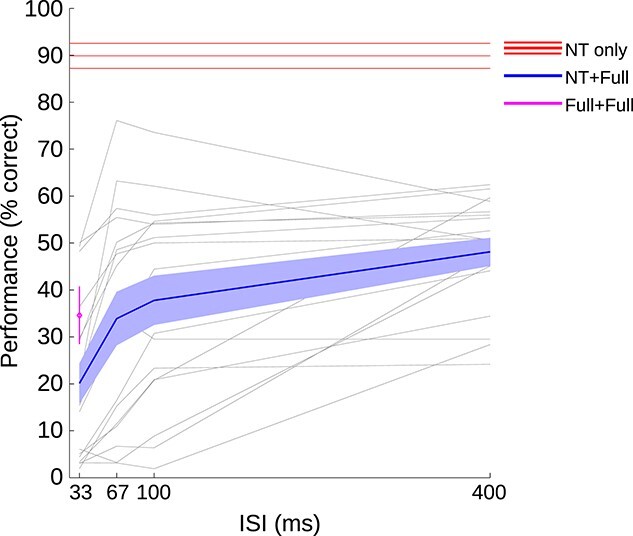
Fig. 3.

Percent correct responses in enumerating the number of flashes (only including trials in which the flash was correctly localized in spatial location). Blue lines indicate performance in the main experimental condition, in which 1 NT flash and 1 full contrast stimulus were presented (NT + Full). The solid line shows the mean and the shaded area indicates the standard error of the mean across participants. The red line shows performance in the NT-only condition (mean and SEM across participants). The magenta symbol, at 33 ms, shows performance for 2 full pulses separated by a 33 ms ISI (mean and SEM across participants). The faint gray lines represent performance of individual participants in the NT + Full condition.
