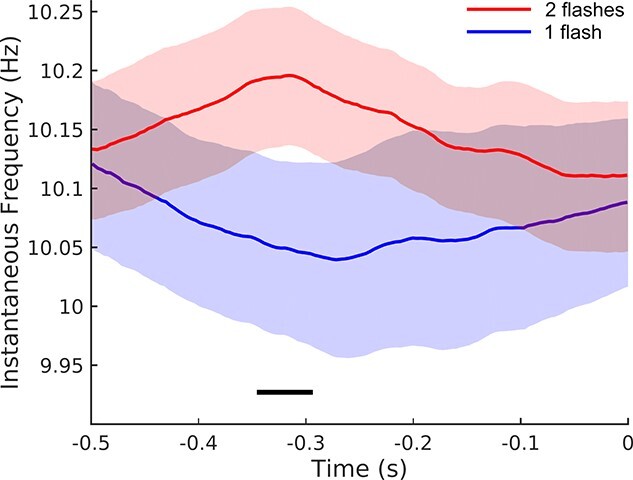
Fig. 7.

Pre-stimulus instantaneous alpha frequency. Within-participants analysis comparing NT + Full trials in which participants correctly reported 2 flashes (red) versus those trials in which participants reported only one flash (blue), mean across participants and within-participant SEM. Time zero indicates the location of the first flash. The black line indicates the temporal location of a significant difference (cluster-corrected permutation test; P < 0.05). The legend indicates the perceptual outcome as reported by the participants, since all trials were in fact 2-flash presentations (NT + Full).
