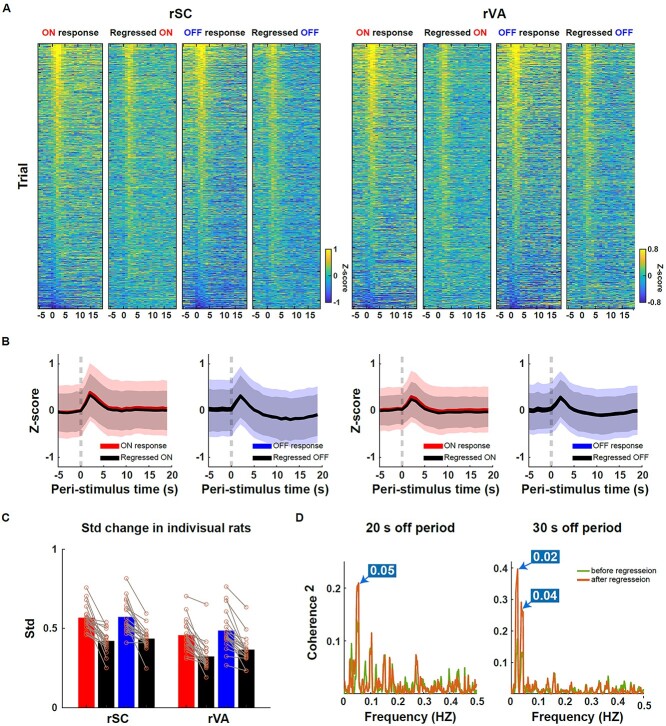
Fig. 4.
Ongoing response regression increased the reliability of the measured BOLD response. A) The trial-by-trial ON and OFF responses in the rSC (left)/rVA (right) before and after regressing out the ongoing activity. Trials were sorted in a descending order according to the averaged response of 1–3 s post-stimulation transition before regression. ON: 2,254 trials; OFF: 2,238 trials. B) Averaged time courses of ON and OFF responses before and after the ongoing activity regression. Shaded area: SD. C) Variance change before and after regression averaged across the entire stimulation duration (−5 to 19 s). Each circle denotes the result from one rat. D) The BOLD signal became more coherent with the Ca2+ signal at the stimulation frequencies after the ongoing BOLD activity regression. The on duration was always 20 s, while the off duration was in either 20 s (n = 16 runs) or 30 s (n = 18 runs). The frequencies where the highest peaks of the magnitude-squared coherence occurred across the 2 paradigms well matched the visual stimulation frequencies.

