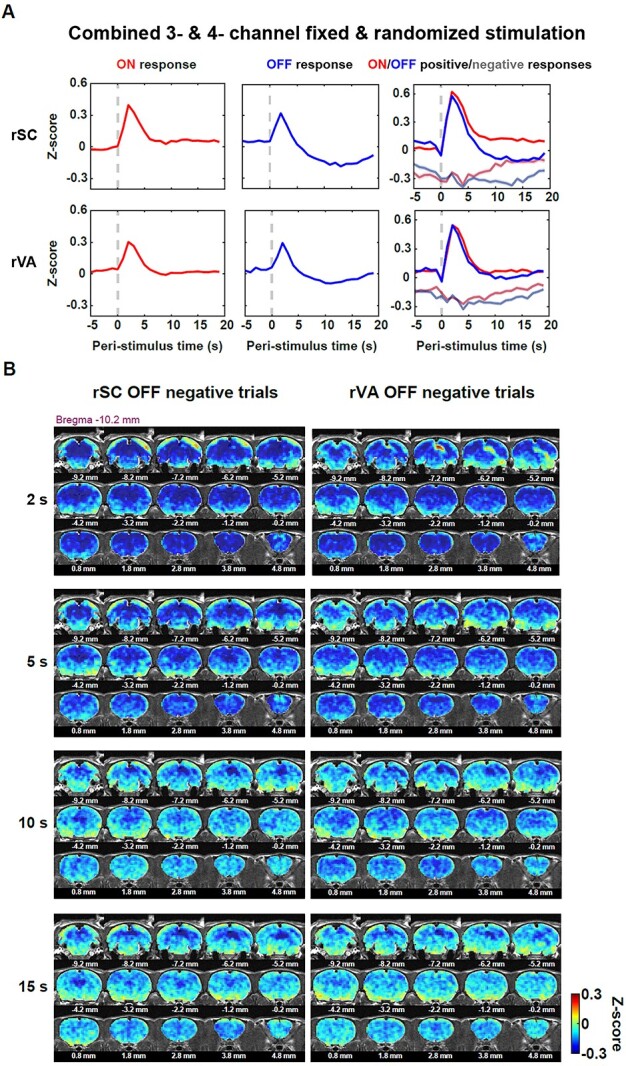
Fig. 5.

Negative trials contribute to the undershoot observed after the evoked OFF response. A) ON/OFF trials of the rSC and rVA were separated into positive and negative trials based on the BOLD response during 1–4 s post-stimulation transition. The first 2 columns: the averaged ON (red) and OFF (blue) time courses for the rSC and rVA, respectively. The third column: averaged BOLD time courses for ON positive (red)/negative (gray-red) and OFF positive (blue)/negative (gray-blue) trials for the rSC and rVA. Shaded area: SEM. B) The pattern of brain-wide BOLD activity of the rSC/rVA negative trials. Most of the regions were negative right after the stimulation offset (2 s) for both the rSC and rVA’s OFF negative trials, except that positive activation occurred around the rVA in the rSC negative trial response pattern, and positive activation occurred around the rSC in the rVA negative trial response pattern. The late negative response (10–15 s) was stronger in the rSC and rVA, than the rest of the brain.
