Figure 1.
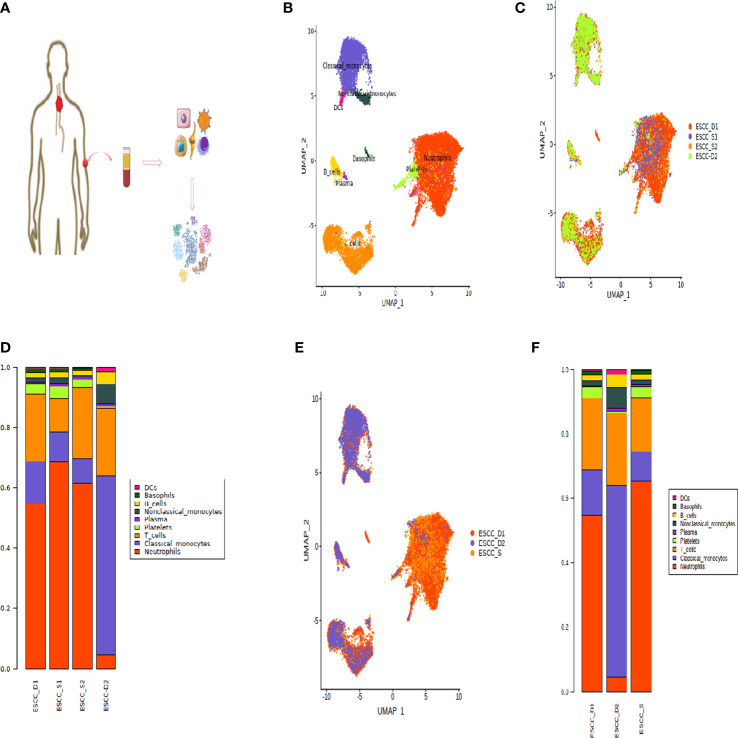
Peripheral blood single cell atlas of patients with esophageal cancer. (A) Workflow showing the scRNA-seq experimental design and initial data exploration. (B, C) UMAP plot of 18,121 high-quality immune cells to show nine main cell-types based on the expression of known marker genes, colored by cell type and cell origin respectively. (D) The proportion of cells that contributed to each cluster by each sample, colored by cell types. (E) UMAP plot of 18,121 high-quality immune cells to show nine main cell-types based on the cell sources. (F) The proportion of cells that contributed to each cluster.

