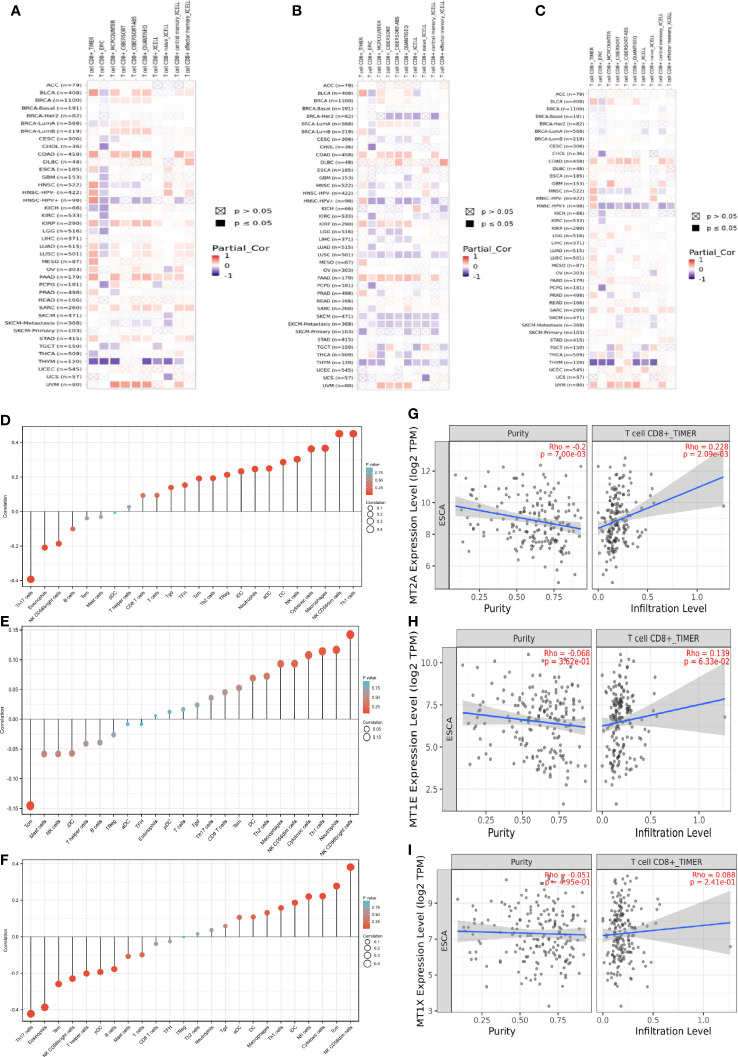
Figure 4.
Prognostic correlation analysis of MT2A, MT1X and MT1E. (A–C) The correlation between MT2A, MT1E, MT1X expression and CD8+ T cells in various malignancies was analyzed by various databases. (D–F) TIMER database was used to analyze the relationship between MT2A, MT1E, MT1X expression and various immune cell infiltration in ESCC. (G–I) The relationship between MT2A expression and CD8+ T cell infiltration in ESCC was analyzed by TIMER database.

