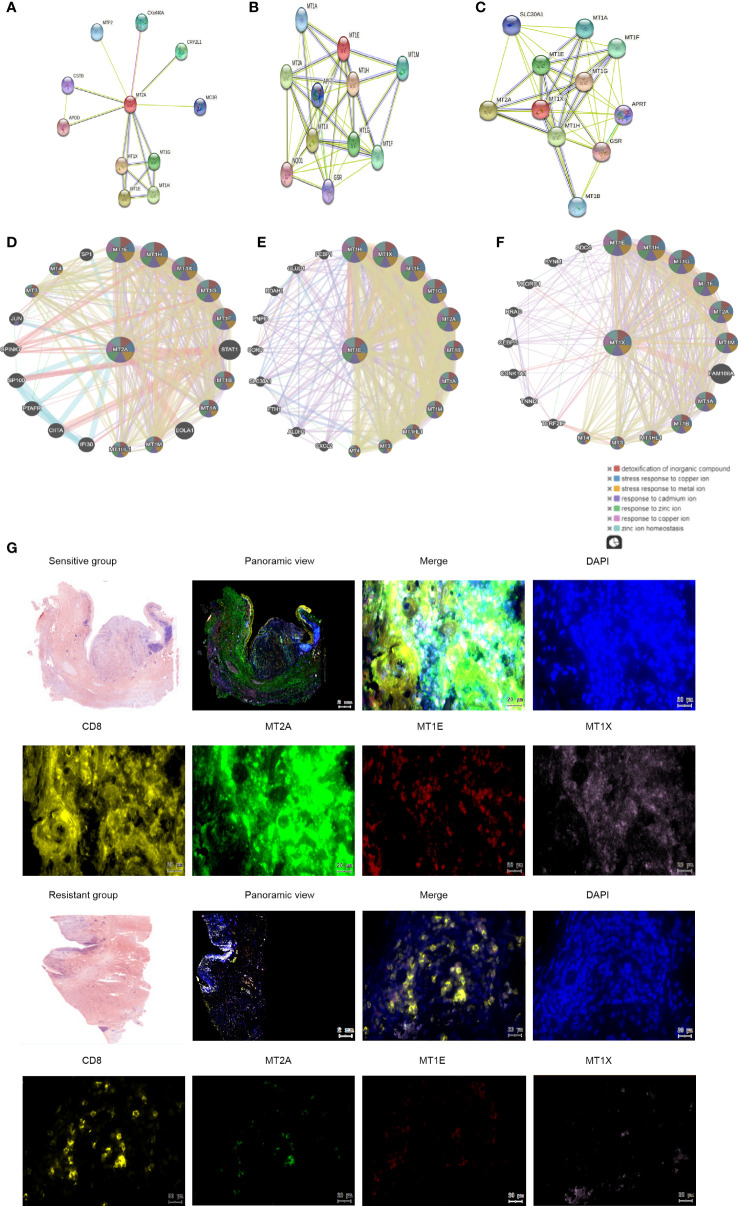
Figure 5.
Molecular interactions of MT2A, MT1X and MT1E. (A–C) String database analysis of genes interacting with MT2A, MT1E and MT1X. (D–F) GeneMANIA database was used to analyze the interaction between MT2A, MT1E and MT1X. (G) The expression of MT2A, MT1E and MT1X in PD-1 mMAB sensitive and resistant esophageal cancer tissues was detected by multicolor immunohistochemical assay (n=3).

