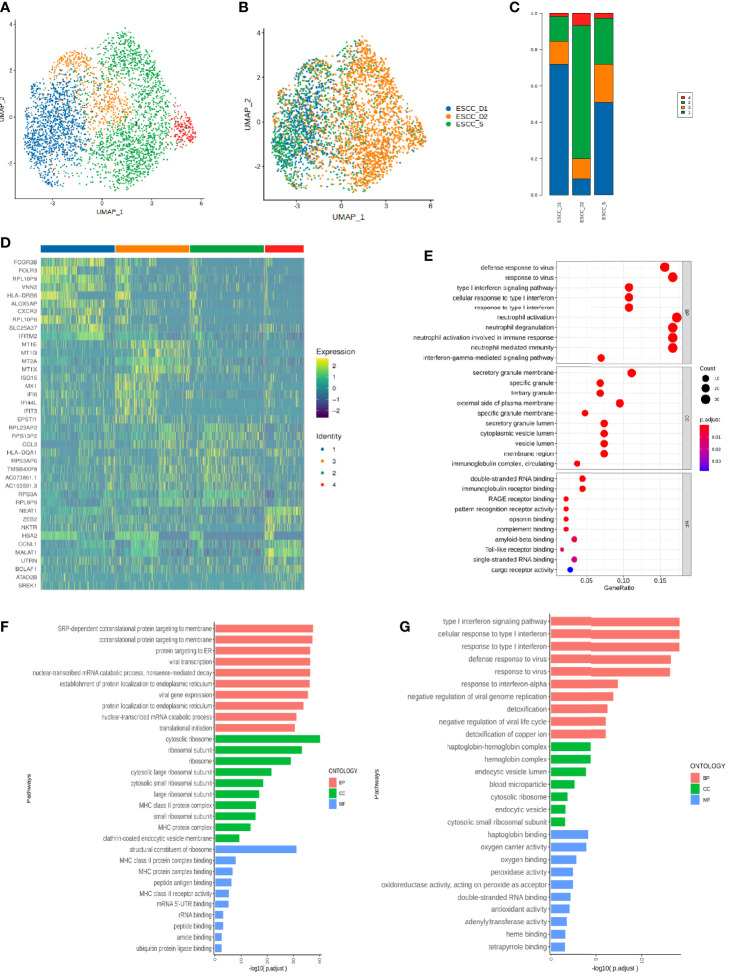
Figure 6.
Single-cell subsets of mononuclear cells in peripheral blood of ESCC. (A)UMAP showing the clustering of monocyte subsets based on the expression of marker genes. Each dot corresponds to one single cell colored according to cell cluster. (B) UMAP showing the merge monocyte cells from ESCC patients. (C) The proportion of cells that contributed to each cluster by each sample. (D) The heat map shows the relative expression levels of differential genes in each subtype of monocytes. (E–G) GO enrichment analysis of monocyte Cluster 1-3.

