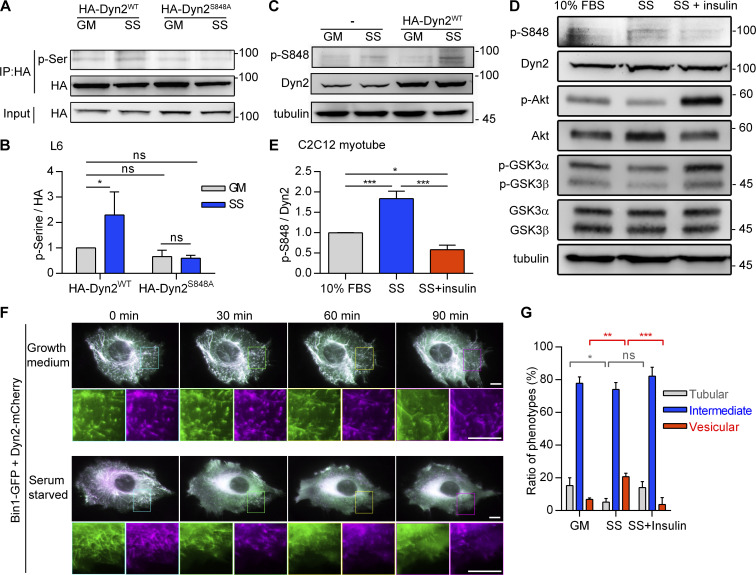
Figure 5.
The phosphorylation of Dyn2S848 is regulated by insulin signaling. (A and B) Phosphorylation of Dyn2 in response to SS. HA-tagged Dyn2WT or Dyn2S848A expressed in L6 myoblasts were precipitated by anti-HA antibody with or without SS. Phosphorylated Dyn2 was quantified by anti-phospho-serine antibody and normalized with precipitated HA intensity compared with HA-Dyn2WT in growth medium and shown in B (n = 3 experimental replicates). (C–E) Phosphorylation of endogenous Dyn2 in response to SS and insulin. C2C12 myotubes were subjected to growth medium (10% FBS), 3-h serum-free medium (SS; C), or SS followed with 30-min, 100 nM insulin stimulation (D). Cell lysates were harvested and detected by Western blotting with indicated antibodies. The ratio of phosphorylated Dyn2S848 was quantified and shown in E (n = 3 experimental replicates). (F) Time-lapse representative images of Bin1-GFP tubules in cells cotransfected with Dyn2-mCherry and cultured in growth or serum-free medium. Boxed areas were magnified and shown in the lower panel. Scale bar, 10 μm. (G) Effects of insulin signaling on Bin1 tubule morphology. Bin1-GFP were transfected into myoblasts together with Dyn2-mCherry and cultured in growth medium, serum-starved, or starved followed by 60-min insulin stimulation. The population of cells with tubule, intermediate, or vesicular Bin1 morphology were quantified (n ≥ 75 cells from three independent repeats). Scale bar, 10 μm. Data are shown as average ± SD and analyzed with one-way ANOVA. *P < 0.05; **P < 0.01; ***P < 0.001. Molecular weight is in kD. Source data are available for this figure: SourceData F5.

