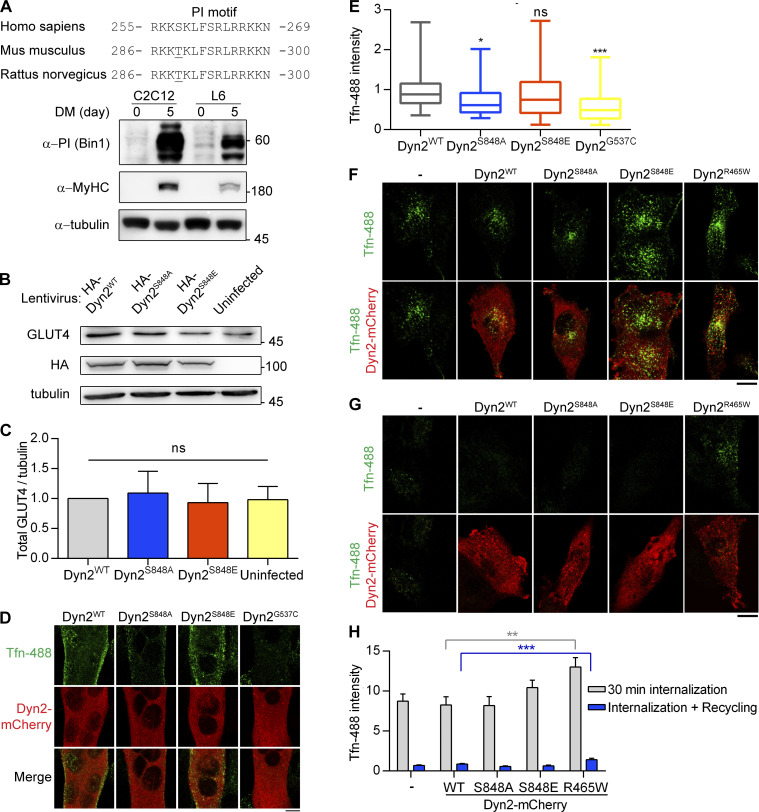
Figure S3.
Dyn2-Ser848 phosphorylation promotes endocytosis, but not exocytosis. (A) Amino acid sequences of Bin1-PI motif from different organisms (top). The expression of muscle-specific Bin1 in C2C12 or L6 myoblasts cultured in growth medium or DM was examined by Western blotting using anti-PI motif antibody (bottom). (B and C) The amount of endogenous GLUT4 in C2C12 myotubes expressing different Dyn2 mutants. C2C12 myotubes infected with indicative HA-Dyn2 mutant lentiviruses expressed a similar level of GLUT4, and the data were quantified, normalized to WT, and shown in B (n = 4 experimental replicates). (D and E) Effect of Dyn2 mutants on transferrin internalization in myotubes. C2C12 myoblasts transfected with indicated Dyn2-mCherry mutants and differentiated into myotubes were incubated with Tfn-488 at 37°C for 20 min. Cells were then washed on ice, fixed, and imaged under confocal microscopy. Scale bar, 10 µm. Fluorescence intensity of internalized transferrin was quantified, normalized to Tfn-488 intensity of Dyn2WT transfected cells, and shown in E (n ≥ 24 cells over two independent repeats). (F–H) Effects of Dyn2-S848 mutants on transferrin internalization or recycling in L6 myoblast. L6 myoblasts expressing indicative Dyn2-mcherry mutants were subjected to 30-min Tfn-488 uptake, wash, and imaging (F). The recycling efficiency of these internalized transferrin was analyzed by chasing the signal by 30-min incubation of growth medium without Tfn-488 (G). The intensity of internalized Tfn-488 was quantified and shown in H (n ≥ 25 cells over three independent repeats). Scale bar, 10 µm. Bar graphs are shown as average ± SD, box plots are shown as median ± min and max value. Data are analyzed with one-way ANOVA. *P < 0.05; **P < 0.01; ***P < 0.001. Molecular weight is in kD. Source data are available for this figure: SourceData FS3.

