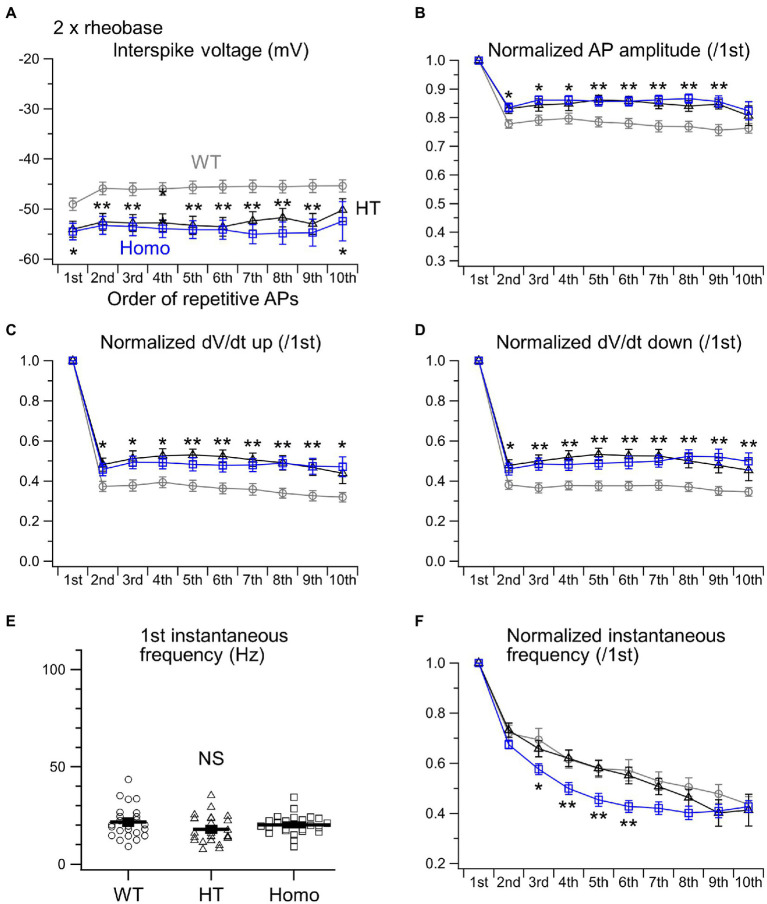
Figure 4.
Properties of repetitive AP firing induced by 2 × rheobase. (A) Interspike voltage levels were defined as the minimum membrane voltage levels between adjacent AP spikes. The initial 10 interspike voltages were compared between WT (gray), HT (black) and Homo (blue) neurons. (B) The amplitudes of initial 10 APs were normalized to that of the first AP. (C) dV/dt ups of initial 10 APs were normalized to the first. (D) dV/dt downs of initial 10 APs were normalized to the first. *p < 0.05, **p < 0.01, WT vs. HT and Homo by REGW-F. (E) Comparison of the first instantaneous frequency. Symbols indicate the values in individual neurons, and thick bars with error bars indicate means ± SEMs. WT: 21.7 ± 1.7 Hz, HT: 17.9 ± 1.5 Hz, Homo: 20.2 ± 1.0 Hz, p = 0.184 by ANOVA. NS, not significant. (F) The initial 10 instantaneous frequencies were normalized to the first. * at 3rd, p < 0.05, WT vs. HT and Homo by K-W. ** at 4th, p < 0.01, WT vs. HT and Homo by Dunnett’s T3. ** at 5th, p < 0.01, WT vs. HT and Homo by REGW-F. ** at 6th, p < 0.01, WT vs. HT and Homo by K-W.

