Figure 6.
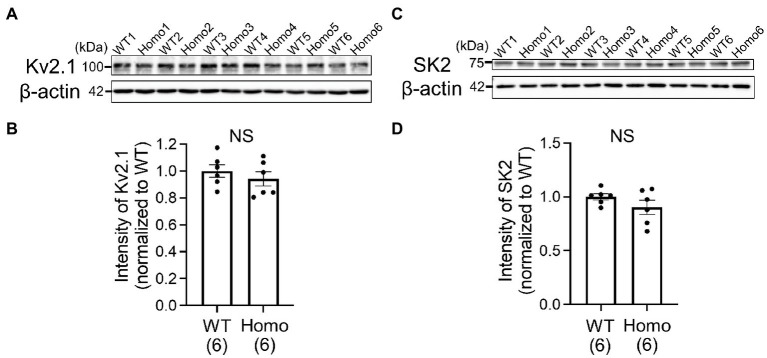
Comparison of protein expression levels of Kv2.1 and SK2 channels in the neocortex of WT and TauT Homo KO mice by Western blot analysis. (A) Immunoblots indicating the levels of Kv2.1 and β-actin in individual neocortices of WT and Homo KO mice. Lysates from six WT (WT1-WT6) and six Homo (Homo1-Homo6) mice were loaded onto the same polyacrylamide gel and blotted onto the same membrane. (B) Statistical comparison of Kv2.1 levels between WT and Homo mice. The ratio of Kv2.1 band intensity to β-actin band intensity in each lane was normalized to the mean of the ratios in the six WT lanes. Normalized ratios are plotted for each group of WT and Homo, with the height of the bar representing the mean in each group. Error bars indicate SEMs. The numbers in brackets indicate the numbers of mice analyzed. p = 0.394 by Mann–Whitney U test. NS, not significant. (C) Immunoblots for SK2 made in the same way as in (A). (D) Comparison of SK2 levels. The ratio of SK2 intensity to β-actin intensity in each lane was normalized to the mean of the ratios in the six WT lanes. p = 0.394 by Mann–Whitney U test.

