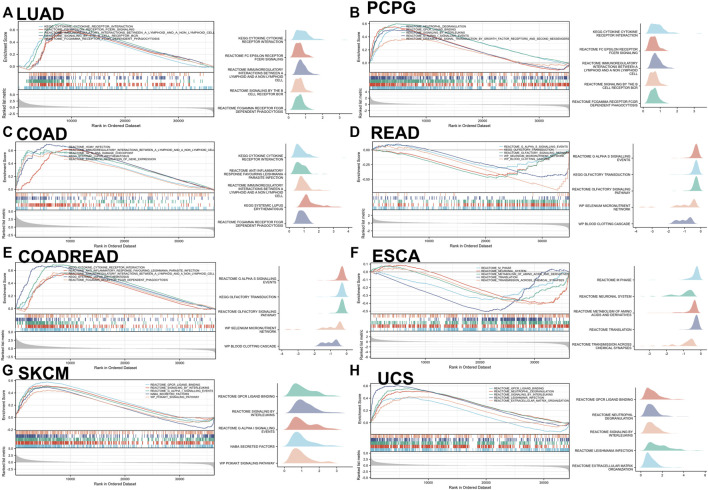
FIGURE 6.
GSEA analysis in KEGG signature of IL-15 in LUAD (A), PCPG (B), COAD (C), READ (D), COADREAD (E), ESCA (F), SKCM (G), and UCS (H). The left panel: Different color curves show different functions or pathways (Top 5). The peak of the upward and downward curve represents the positive and negative regulation of IL-15, respectively. Score, enrichment score. The right panel: Summary of GSEA plots of representative data is presented. The horizontal axis is the degree of correlation, and the vertical axis is the corresponding pathway.

