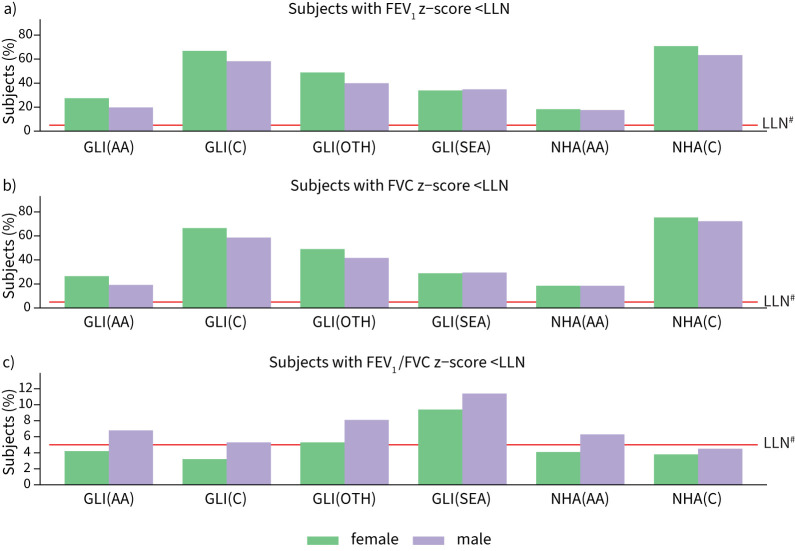
FIGURE 3.
Percentage of healthy subjects categorised as below lower limit of normal (LLN) in a) forced expiratory volume in 1 s (FEV1), b) forced vital capacity (FVC) and c) FEV1/FVC using Global Lung Initiative (GLI) 2012 and National Health and Nutrition Examination Survey (NHANES) III reference values for different ethnic groups, stratified by gender (n=7453). GLI(AA): GLI 2012 (African-American); GLI(C): GLI 2012 (Caucasian); GLI(OTH): GLI 2012 (others); GLI(SEA): GLI 2012 (South-East Asian); NHA(AA): NHANES III (African-American); NHA(C): NHANES III (Caucasian). #: the expected LLN in a healthy population at 5%.

