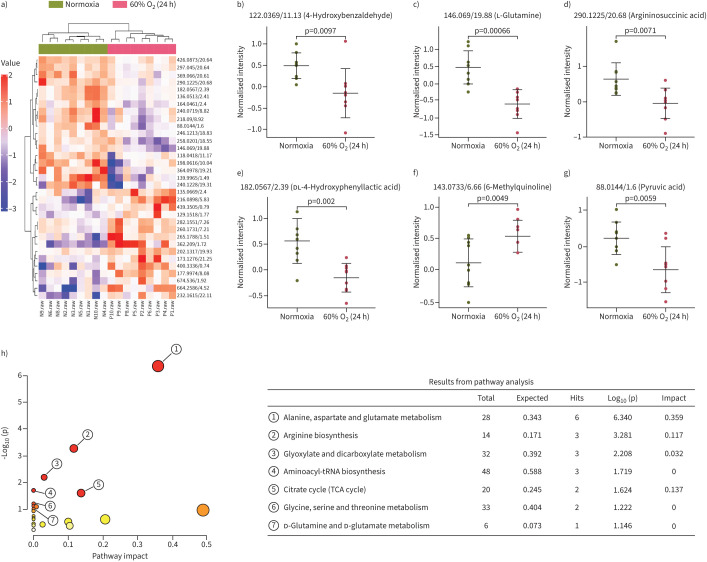
FIGURE 3.
Metabolic profiles with metabolite compositions and metabolic pathways. a) Heat map analysis of metabolite compositions between 60% oxygen (O2) (24 h) and normoxia groups. b–g) Quantitation of the levels of b) 4-hydroxybenzaldehyde, c) l-glutamine, d) argininosuccinic acid, e) dl-4-hydroxyphenyllactic acid, f) 6-methylquinoline and g) pyruvic acid; two-tailed t-test. h) The metabolic pathways identified using MetaboAnalyst 3.0 software. TCA: tricarboxylic acid.

