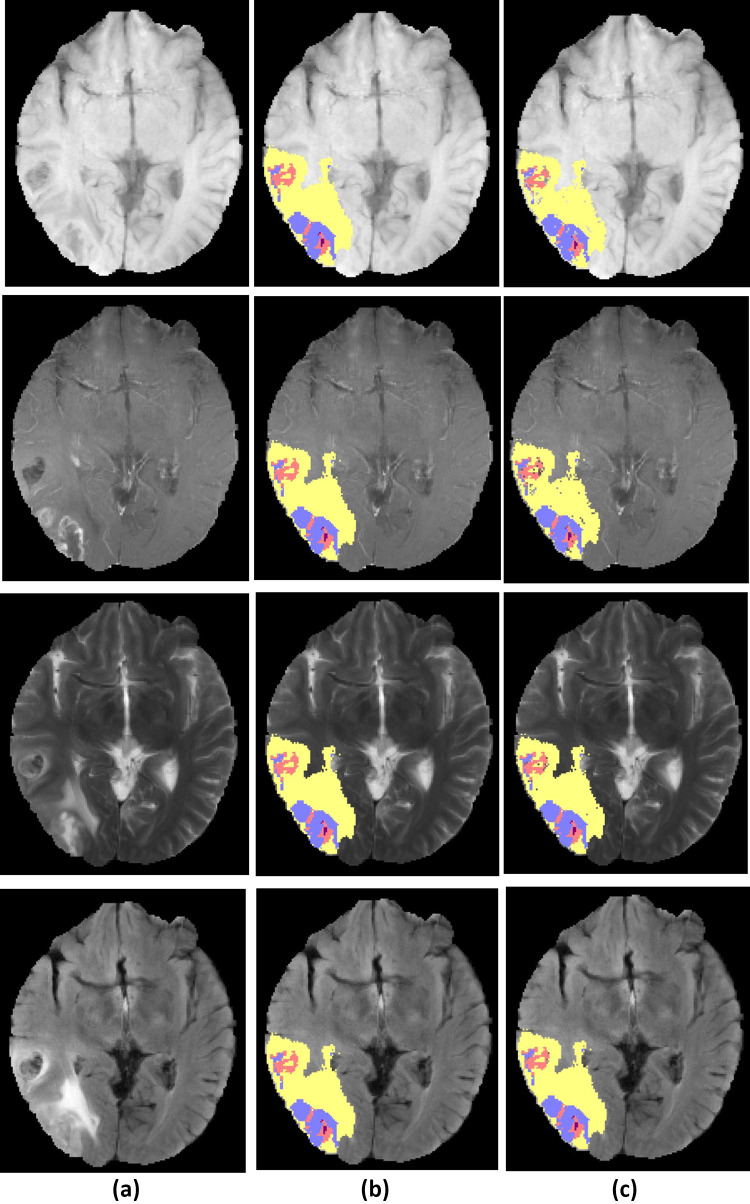
Fig. 5.
Example of high-grade glioma patient from BRATS dataset, a original image, b ground truth tumor regions, c segmented tumor region result of proposed framework. The row 14 from up to down, show the modalities , , , and . Tumor structure consists of edema (yellow), non-enhancing core (red), enhancing core (blue) and necrosis (purple)

