Figure 3.
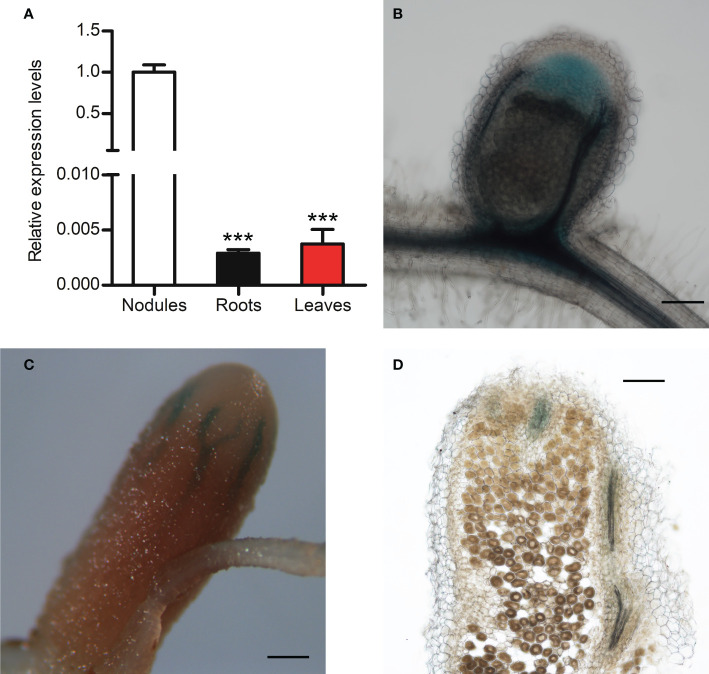
Analysis of MtCHIT5b expression in M. truncatula nodules. (A) RT-qPCR analysis of MtCHIT5b transcript levels in nodules of M. truncatula R108 inoculated with S. meliloti Rm41 and harvested at 3 wpi. For comparison, MtCHIT5b expression was also analyzed in roots and leaves of these plants. Data indicate means ± SE of normalized values (mean value of nodules set to one) from three independent RNA extractions (n = 3) (Student’s t-test; ***, P< 0.001). (B-D) GUS staining analysis of R108 nodules expressing the MtCHIT5bp-GUS construct at 3 wpi (B) and 4 wpi (C, D). The picture in (D) shows a sectioned nodule. Bars = 200 μm in (B, D); 500 μm in (C).

