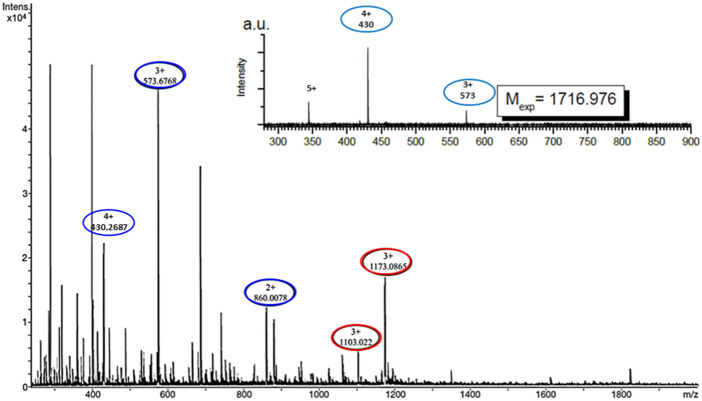
FIGURE 8.
Electrospray ionisation mass spectra showing Lipid A binding to KDEON WK-11 represented by ion complex formation seen as single peaks expressing the molecular mass of both components. Red circles present at peaks 1103 and 1173 indicate the presence of the peptide-ion complex, proving the binding of KDEON WK-11. Blue circles at peaks 430, 573 and 860 (m/z), indicate the peptide alone (4+, 3+, 2 + charge state respectively of WK11), showing the significant difference between the two, in the presence and absence of ion complex formation. The inset indicates the spectrum of the peptide alone.

