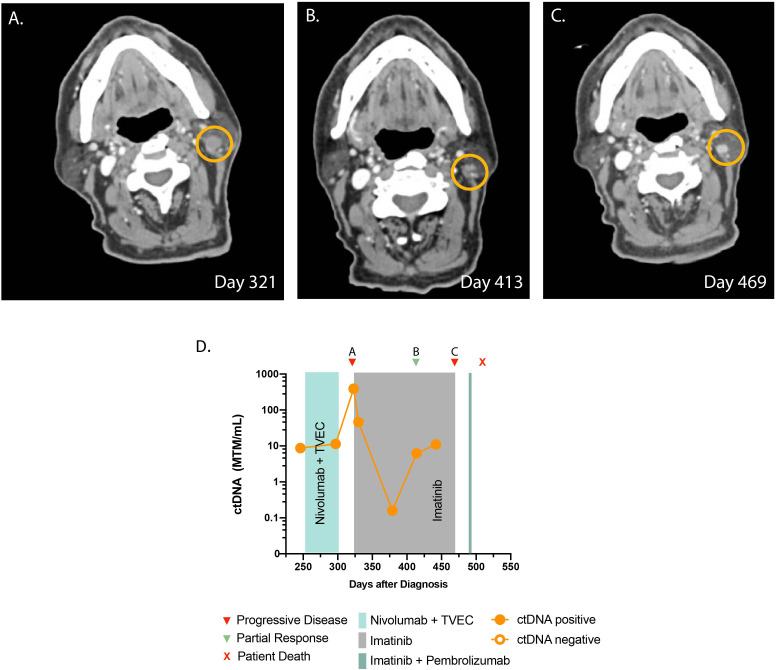
Figure 2.
Timeline and imaging of case 2. (A) Cross-sectional CT demonstrates progression of infiltrative lesions in a left level 2B lymph node prior to starting imatinib. (B) CT demonstrates a decrease in the size of the lesion after starting imatinib. (C) CT demonstrates progressive disease. (D) Timeline of administered systemic therapy and ctDNA changes (no ctDNA is available beyond day 450 as the patient opted not to have the test).

