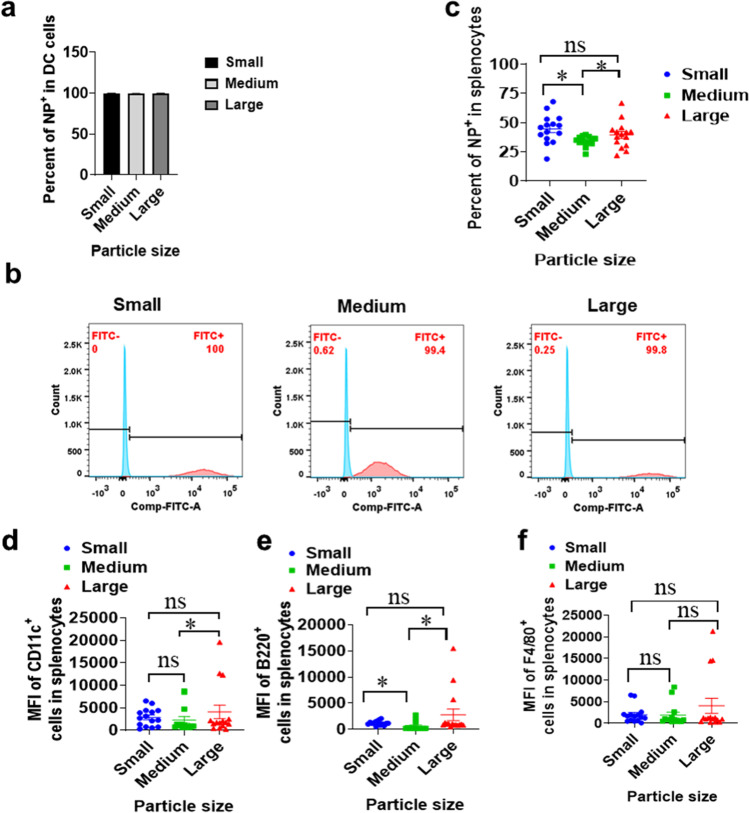
Fig. 2.
Cellular uptake FITC-lipid complexes with different particle sizes. (a-b). The percentage of NP+ cells in DC2.4 live cells (n = 6). (c). The percentage of NP+ cells in splenocytes (n = 15). (d). The mean fluorescence intensity (MFI) of B220+ cells (B cells) in splenocytes. (e). The MFI of F4/80+ cells (macrophages) in splenocytes. (f). The MFI of CD11c+ cells (DC) in splenocytes. * means with significant difference and P < 0.05; ns means not significant.

