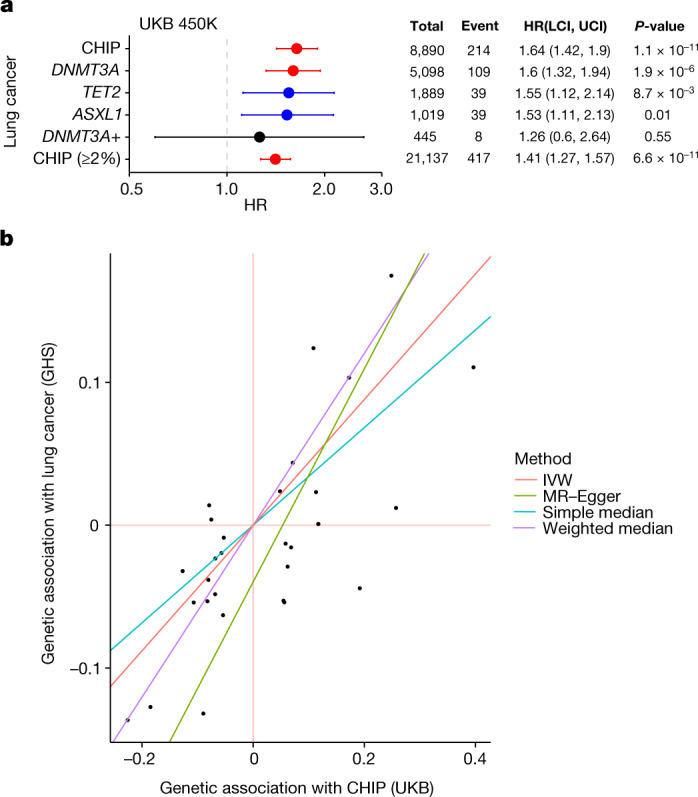
Fig. 4. Increased risk of lung cancer among CHIP carriers.

a, Forest plot and table featuring hazard ratio estimates from Cox proportional hazard models of the risk lung cancer among CHIP carriers. Error bars represent a 95% confidence interval. Associations are similar across common CHIP subtypes, as well as among CHIP carriers with lower VAF (≥2%). Models are adjusted for sex, low density lipoprotein, high density lipoprotein, smoking status, pack years, BMI, essential primary hypertension, type 2 diabetes mellitus, and 10 genetic principal components specific to a European ancestral background. HR, hazard ratio. UKB 450K, the 450,00-participant full UKB dataset. DNMT3A+ represents subjects with DNMT3A CHIP and at least one other type of CHIP mutation. b, Estimated associations via four Mendelian randomization methods between CHIP and lung cancer. Each point represents one of 29 instrumental variables (that is, conditionally independent SNPs) that were identified in the UKB cohort as associated with CHIP. The x-axis shows the effect estimate (beta) of the SNP on CHIP in the UKB cohort, and the y-axis shows the effect estimate (beta) of the SNP on lung cancer in the GHS cohort. The slope of each regression line represents the effect size estimated by respective methods. IVW, inverse variance weighted.
