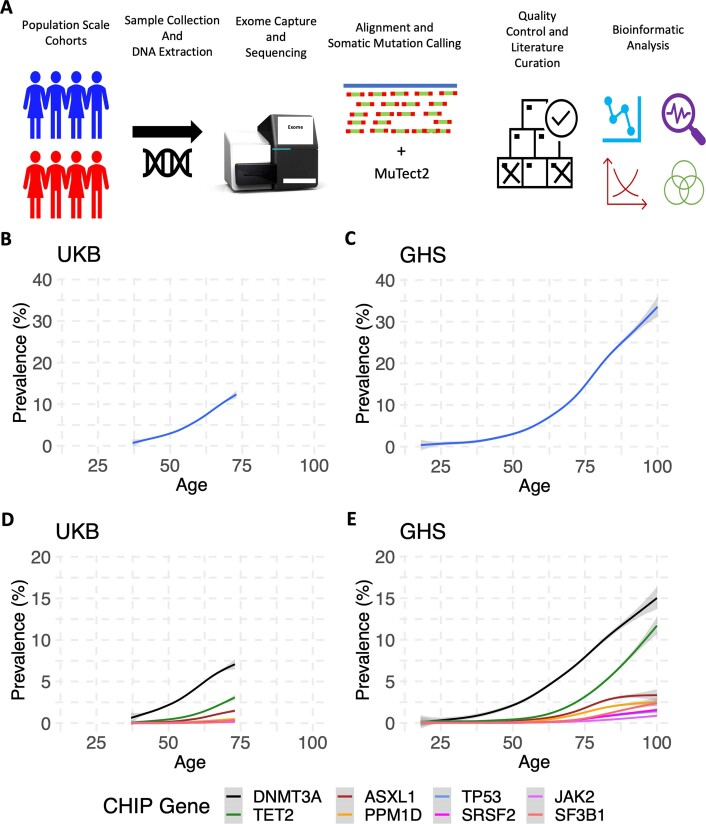
Extended Data Fig. 1. Workflow to Identify CHIP and Prevalence Estimates For Carriers of CHIP Mutations.
A. Graphic depicting at a high-level the workflow used to collect and sequence the exomes of multiple large cohorts and to then identify CHIP mutations from this data. B-C. CHIP prevalence increases with age of donor at time of DNA collection in both the UKB (B, n = 484,629 individuals; one-sided F-test, P < 10−16) and GHS (C, n = 157,724 individuals; one-sided F-test, P < 10−16) cohorts, with the centre line representing the general additive model spline and the shaded region representing the 95% confidence interval. D-E. Similar to B-C, the prevalence of CHIP mutations per CHIP gene for each of the top 8 most common CHIP genes increase with age in the UKB (D, n = 484,629 individuals; one-sided F-test, P < 10−16) and in GHS (E, n = 157,724 individuals; one-sided F-test, P < 10−16).

