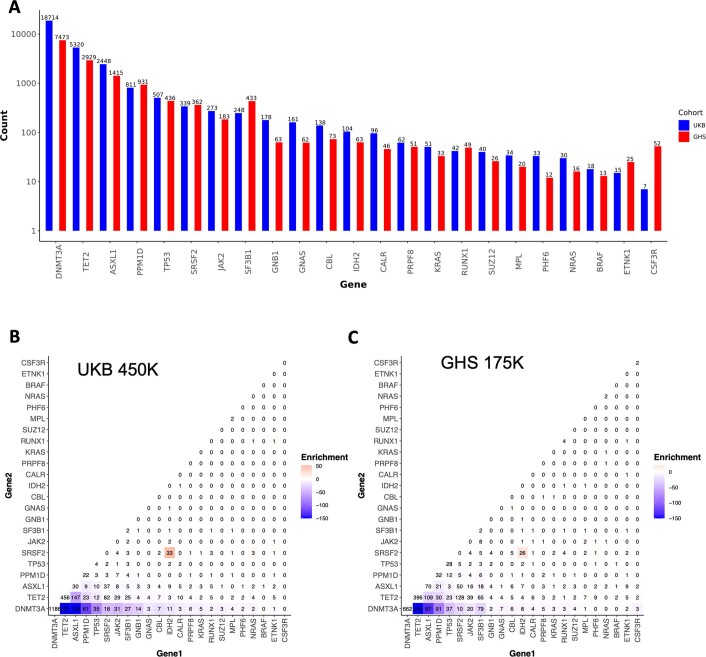
Extended Data Fig. 2. Count Distribution and Pairwise Enrichments of Clonal Hematopoiesis of Indeterminate Potential (CHIP) Gene Mutations.
A. Total number of individuals with mutations (y axis, log10 scale) in each of the 23 genes that were used to determine CHIP status across the UKB (blue) and GHS (red) CHIP callsets. B-C. Pairwise mutation counts across the UKB (B) and DiscoverEHR (C) callsets across individuals with at least two identified CHIP mutations. The color scale reflects the significance of the p-value for association between mutated CHIP gene pairs as determined by logistic regression. Per CHIP gene pair, these models included CHIP gene 1 mutation carrier status as the outcome, CHIP gene 2 mutation carrier status as the predictor, and age, sex, and smoking status (ever vs never) as covariates. P values are log10 transformed (see Table S1 for complete enrichment results).

