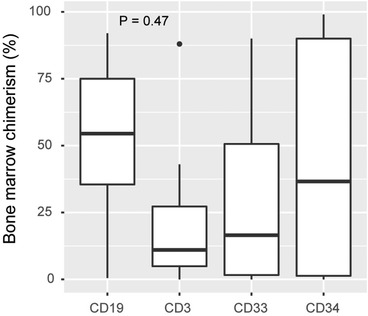
FIGURE 2.

Bone marrow chimerism at relapse. All instances (n = 8) when bone marrow was sampled at relapse +/− 3 days. Boxes represent median and interquartile range. Percent recipient DNA is plotted. The p‐value was calculated using analysis of variance (ANOVA)
