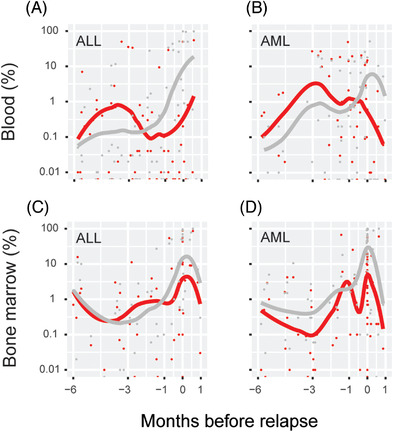
FIGURE 4.

T cell and leukemia cell lineage chimerism kinetics during the months preceding a relapse. All chimerism results from hematopoietic stem cell transplantations (HSCTs) that resulted in a relapse in B cell acute lymphoblastic leukemia (ALL) (n = 28) and acute myeloid leukemia (AML) (n = 37) were extracted, and CD3+ T cell chimerism (red) was compared with the leukemia cell type, CD19+ B cell, or CD33+ myeloid cell chimerism for ALL and AML, respectively (gray). Blood samples (A and B) and bone marrow samples (C and D) are plotted separately, and a locally estimated scatterplot smoothing (LOESS) line was fitted to the data points for each cell type. The time of relapse for each HSCT has been aligned at 0 and the x‐axis
