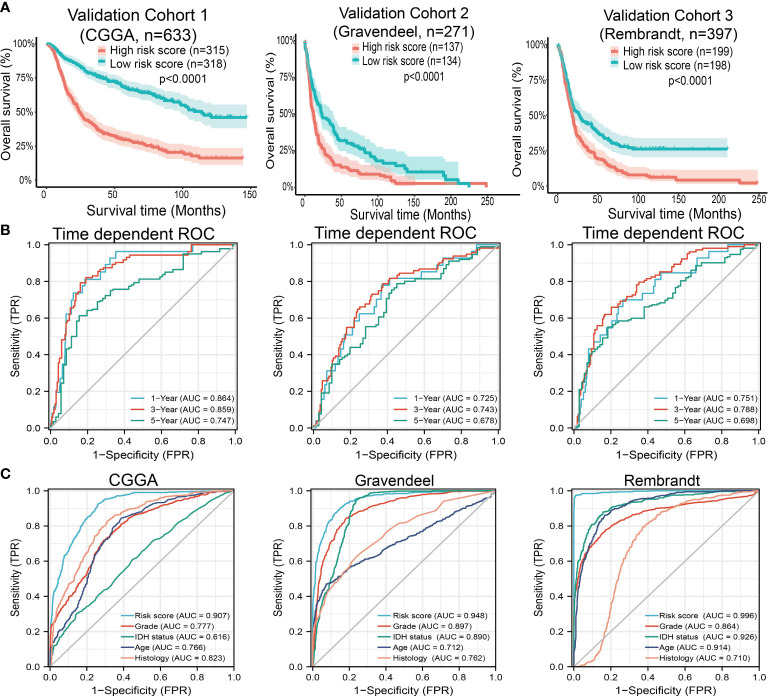
Figure 10.
Predictive powers for prognosis of this nomogram. (A) Kaplan-Meier survival validation in the CGGA, Gravendeel, and Rembrandt cohorts. Patients with high-risk scores had a poor outcomes in terms of overall survival. (B) ROC curves showed the AUC of this nomogram for predicting 1-, 3- and 5-year survival of glioma patients, respectively. (C) ROC curves comparing prognostic accuracy of risk score with clinical histology, grade, IDH status, and age in external validation cohorts. AUC, area under the curve; ROC, receiver operating characteristic.

