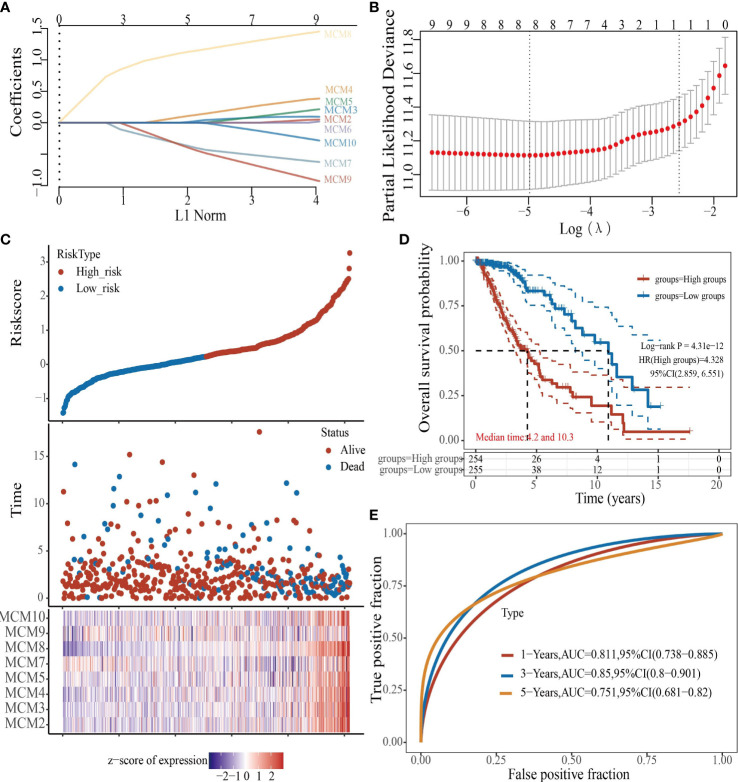
Figure 8.
Construction of a prognostic MCMs model in glioma. (A) LASSO analysis of the expression pattern of the 9 MCMs. (B) Plots of the ten-fold cross-validation error rates. (C) Distribution of risk score, state of existence, and MCMs expression in glioma. (D, E) OS for glioma patients in the high-/low-risk group and the ROC curve of measuring the predictive value.

