. 2022 Sep 27;28(23):5190–5201. doi: 10.1158/1078-0432.CCR-22-2108

Figure 4.

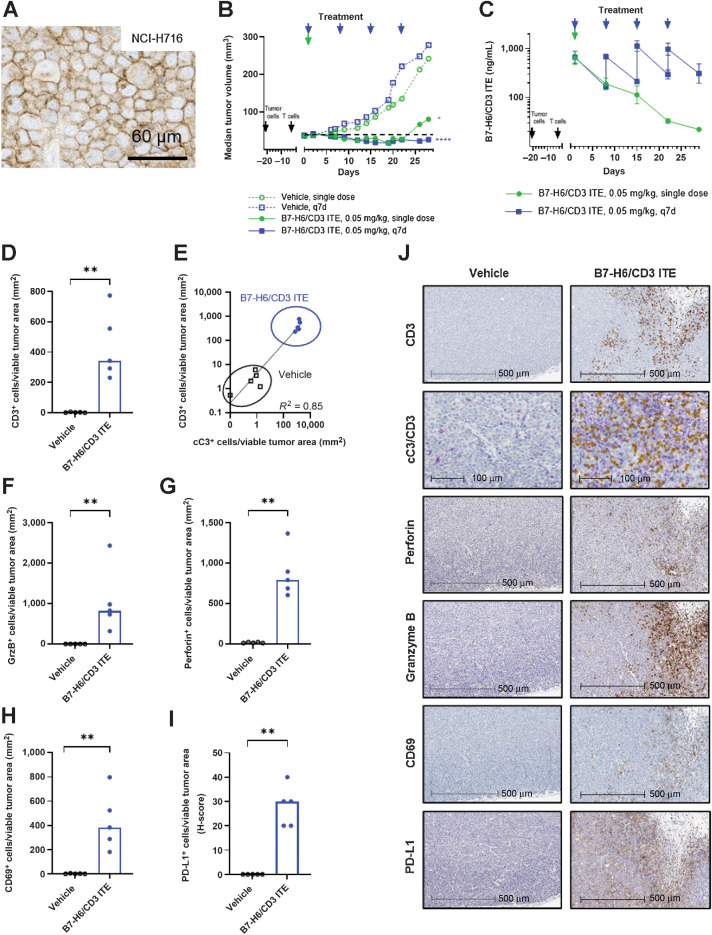
Figure 4. B7-H6/CD3 ITE monotherapy induces antitumor activity and modulation of tumor-infiltrating T cells in human NCI-H716 xenograft tumor-bearing T cell–humanized in vivo mouse model. B7-H6 IHC (A), antitumor activity (each datapoint represents the median of 9 animals; B), pharmacokinetic profile (C; each datapoint represents the mean of 3 animals, error bars represent the SD. E–J, IHC analysis of NCI-H716 xenograft tumors on day 2 for CD3 (D), cC3 (purple; E) and CD3 (yellow), GrzB (F), perforin (G), CD69 (H), and PD-L1 (I). J, Representative IHC stainings. D and F–I, Each datapoint represents 1 animal, bars represent the median, ****, P < 0.0001; ***, P < 0.001; **, P < 0.01; *, P < 0.05.

B7-H6/CD3 ITE monotherapy induces antitumor activity and modulation of tumor-infiltrating T cells in human NCI-H716 xenograft tumor-bearing T cell–humanized in vivo mouse model. A and B, B7-H6 IHC (A), and antitumor activity (B; each datapoint represents the median of 9 animals). C, Pharmacokinetic profile (each datapoint represents the mean of 3 animals, error bars represent the SD). D–J, IHC analysis of NCI-H716 xenograft tumors on day 2 for CD3 (D), cC3 (purple) and CD3 (yellow; E), GrzB (F), perforin (G), CD69 (H), and PD-L1 (I). J, Representative IHC stainings. D and F–I, Each datapoint represents 1 animal, bars represent the median. ****, P < 0.0001; ***, P < 0.001; **, P < 0.01; *, P < 0.05.