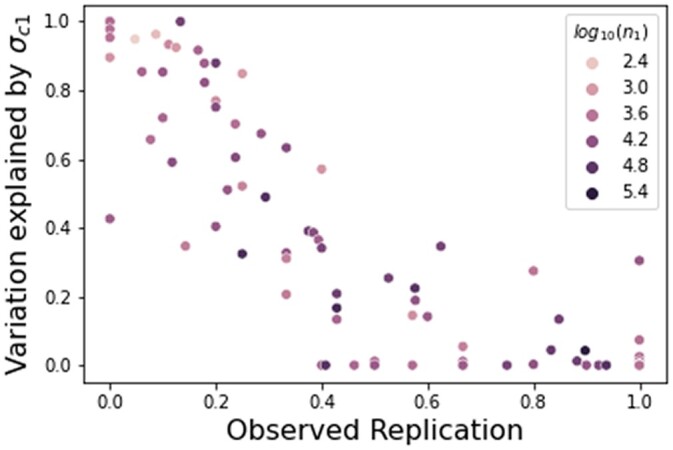
Fig. 7.

Estimated confounding explains observed replication. The x-axis is the observed replication, and the y-axis is the proportion of variance in the discovery study explained by confounding. Each dot represents a single GWAS study. The Spearman correlation between the estimated variance of confounding and true replication rate is −0.88. The color corresponds to the number of individuals in the discovery study. While the estimated confounding in the discovery study explains the replication rate well, sample size does not explain the replication consistently.
