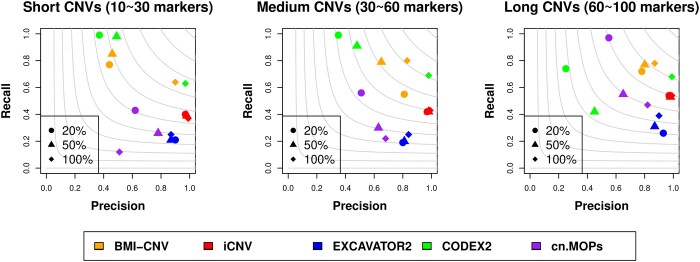
Fig. 3.
Performance assessment of BMI-CNV, iCNV, EXCAVATOR2, CODEX2, cn. MOPs and EnsembleCNV on simulated data in WES analysis. Simulated CNVs are of frequency 20%, 50%, and 100% and length 10–30 markers (short), 30–60 markers (medium), and 60–100 markers (long). The grey contours are F1 scores calculated as the harmonic mean of precision and recall rates.

