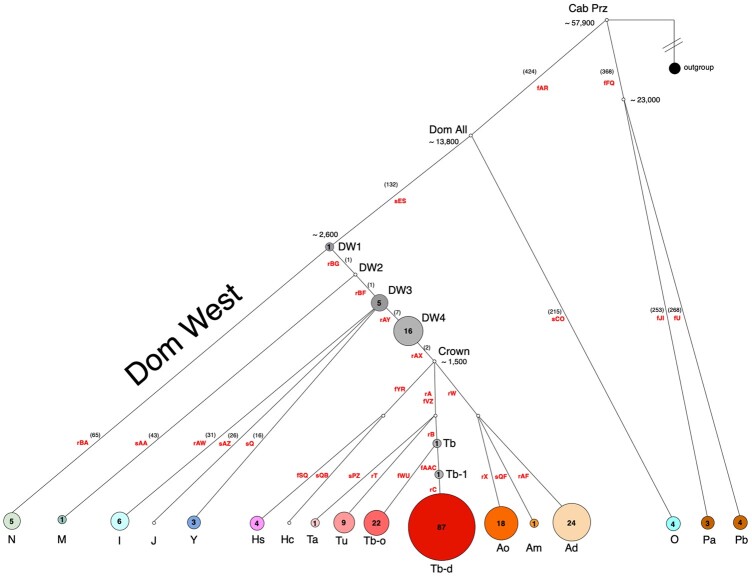
Fig. 2.
HT distribution and frequency plot based on MSY tree modified from (Felkel et al. 2019). HTs are given as circles with HT symbols below and circle radius proportional to the number of clustered individuals. Absolute number of individuals are given inside the circles. Different colors and shades correspond to HTs represented in the dataset, while noncolored points express HTs that were not detected in the sample set. Number of mutations on non-Crown branches in Felkel et al. (2019) are denoted in brackets; in Crown HG they ranged from 5 to 26. Markers used for genotyping are in red font; Domestic West is abbreviated as DW. Estimated splitting times for branching points (years before present) are from Felkel et al. (2019).

