. 2022 Jul 26;305(3):688–696. doi: 10.1148/radiol.211433

Figure 4:

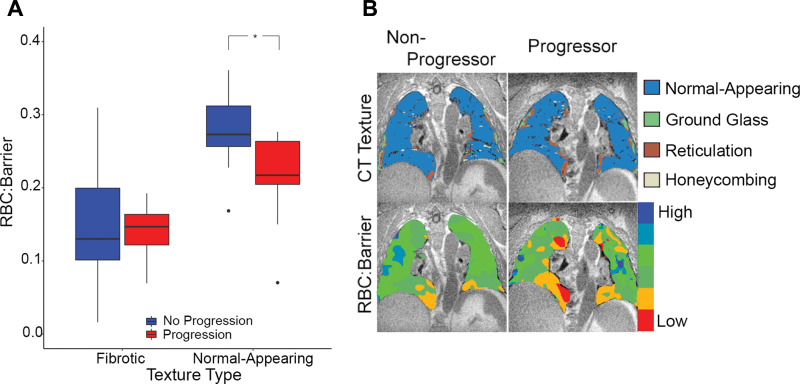
(A) Box plots of the red blood cell (RBC)-to-barrier ratio in fibrotic and normal-appearing lung in progressor and nonprogressor groups. * Statistically significant difference. Note the overall reduced RBC-to-barrier ratio in fibrotic lung and the difference in progression groups in the normal-appearing lung (P = .01) but not in the fibrotic lung (P = .67). (B) Images in a 77-year-old man with idiopathic pulmonary fibrosis (IPF) from the nonprogressor group (left) and a 77-year-old man with IPF from the progressor group (right) show exemplary differences demonstrated on the box plots (A). Note that RBC-to-barrier ratio is uniformly low in fibrotic regions on CT images but also reduced in normal-appearing regions, and more prominently in the participant with progressive IPF.

(A) Box plots of the red blood cell (RBC)-to-barrier ratio in fibrotic and normal-appearing lung in progressor and nonprogressor groups. * Statistically significant difference. Note the overall reduced RBC-to-barrier ratio in fibrotic lung and the difference in progression groups in the normal-appearing lung (P = .01) but not in the fibrotic lung (P = .67). (B) Images in a 77-year-old man with idiopathic pulmonary fibrosis (IPF) from the nonprogressor group (left) and a 77-year-old man with IPF from the progressor group (right) show exemplary differences demonstrated on the box plots (A). Note that RBC-to-barrier ratio is uniformly low in fibrotic regions on CT images but also reduced in normal-appearing regions, and more prominently in the participant with progressive IPF.