
Figure 5.
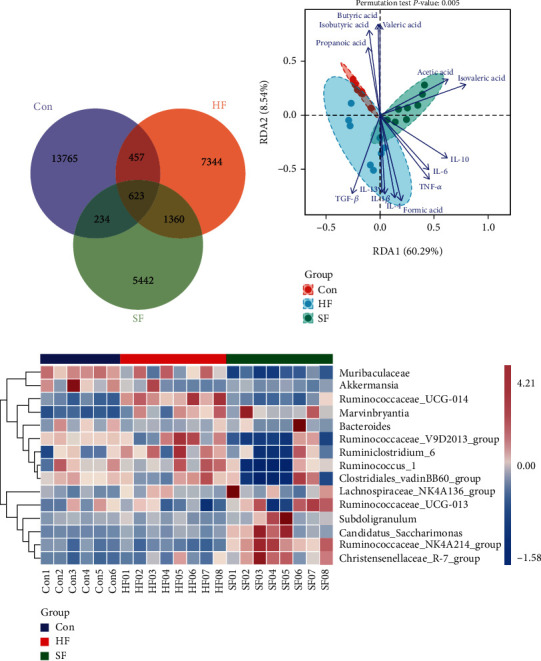
Different species and markers of cecal contents and soft and hard feces. (a) The Wayne diagram drawn by ASV/OUT in three groups of samples of cecal content group and soft and hard feces group. (b) The RDA diagram of correlation analysis between samples of cecal content group and soft and hard feces group and cytokines and SCFAs. (c) Relative abundance of the top 15 bacteria in the cecal content group and soft and hard feces group.