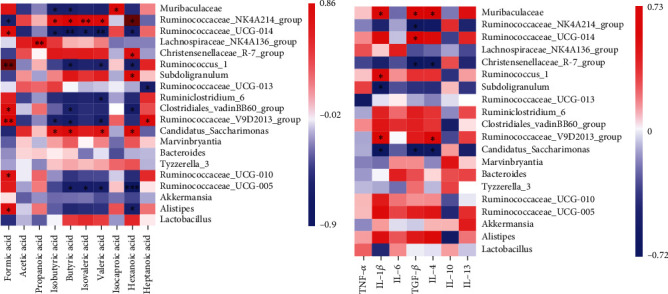
Figure 7.

Correlation analysis between SCFAs, cytokines, and different microbiota. (a) The correlation analysis between the bacteria with the top 15 relative abundance and SCFAs. (b) Correlation analysis between the bacteria with the top 15 relative abundance and cytokines.
