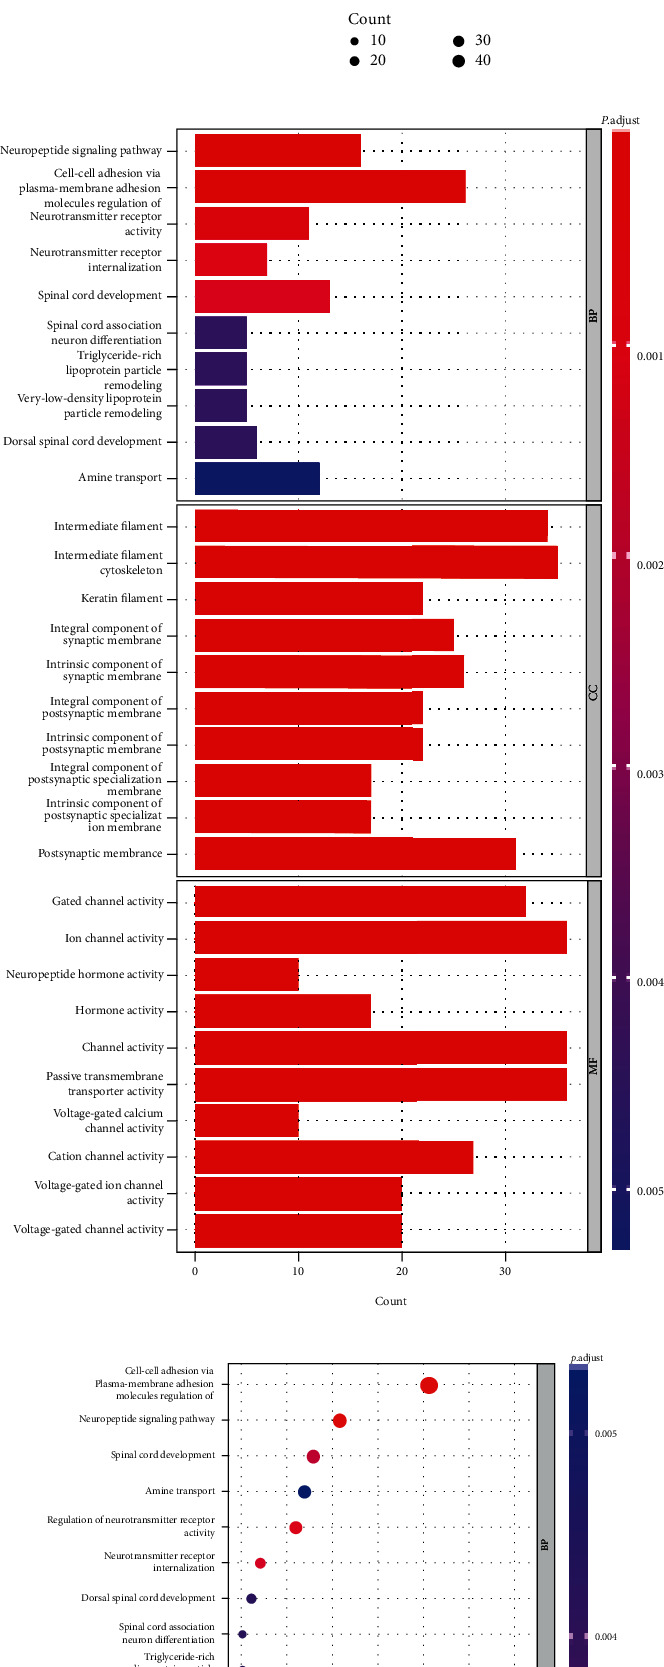
Figure 7.

Identification and functional enrichment analysis of coDEGs. (a) The Venn diagram showed that a total of 1516 coDEGs were obtained. (b, c) Bar and dot plots showed the results of KEGG enrichment analysis of coDEGs. (d, e) Bar and dot plots showed the results of GO enrichment analysis of coDEGs.
