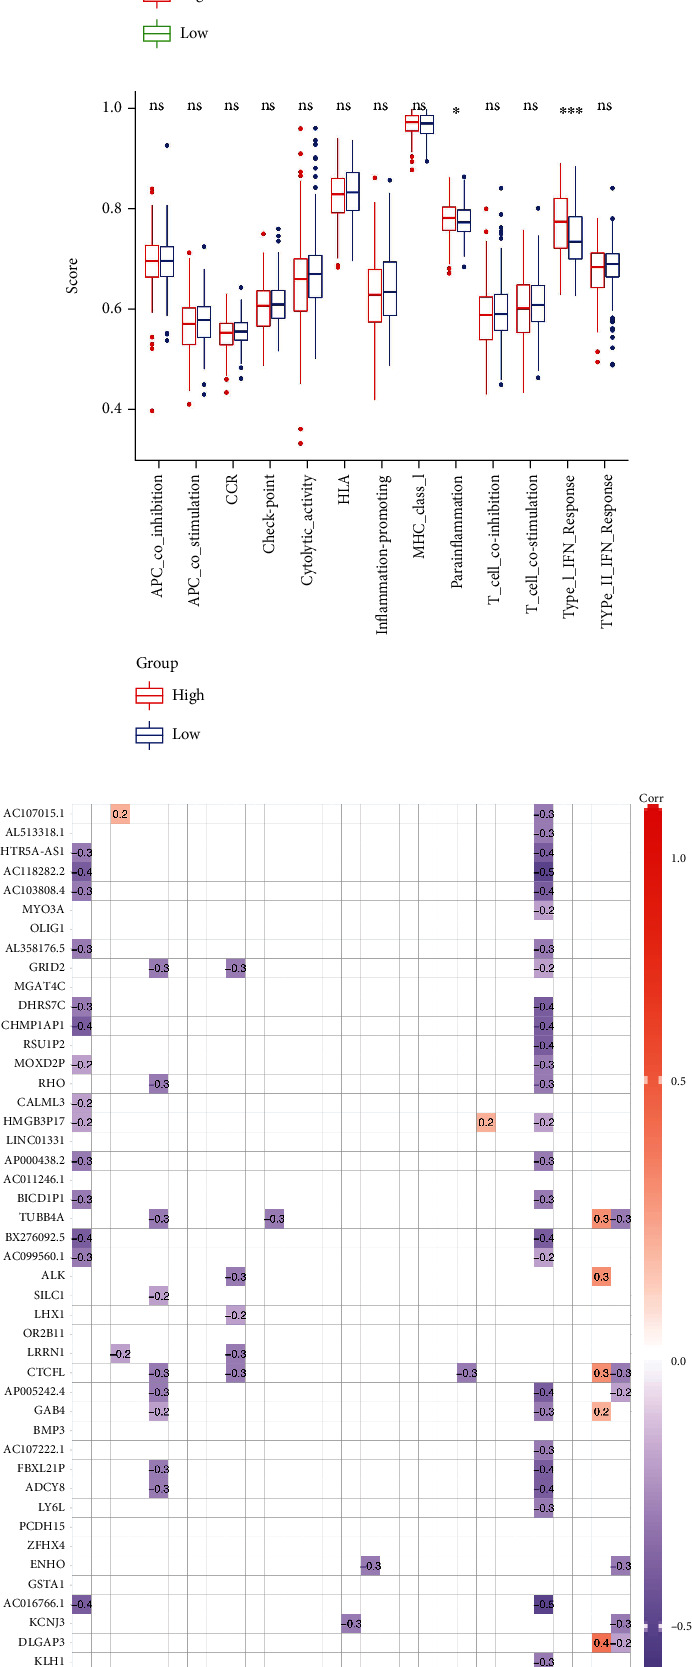
Figure 8.

Immune cell infiltration and immune activity in the tumor microenvironment of UCEC and anticancer drug sensitivity analysis of coDEGs. (a) Heatmap of immune cell infiltration and immune activity in the TCGA-UCEC cohort. (b) Correlation analysis between various immune cells. (c) Correlation analysis between various immune functions. (d) Comparison of the degree of infiltration of various immune cells in the high-risk group and the low-risk group. (e) Comparison of the extent of various immune activities in the high-risk group versus the low-risk group. (f) Correlation analysis of coDEG expression with immune cell infiltration and immune activity. (g, h) Anticancer drug sensitivity analysis based on CTRP and GDSC databases for coDEG expression.
