Figure 1.

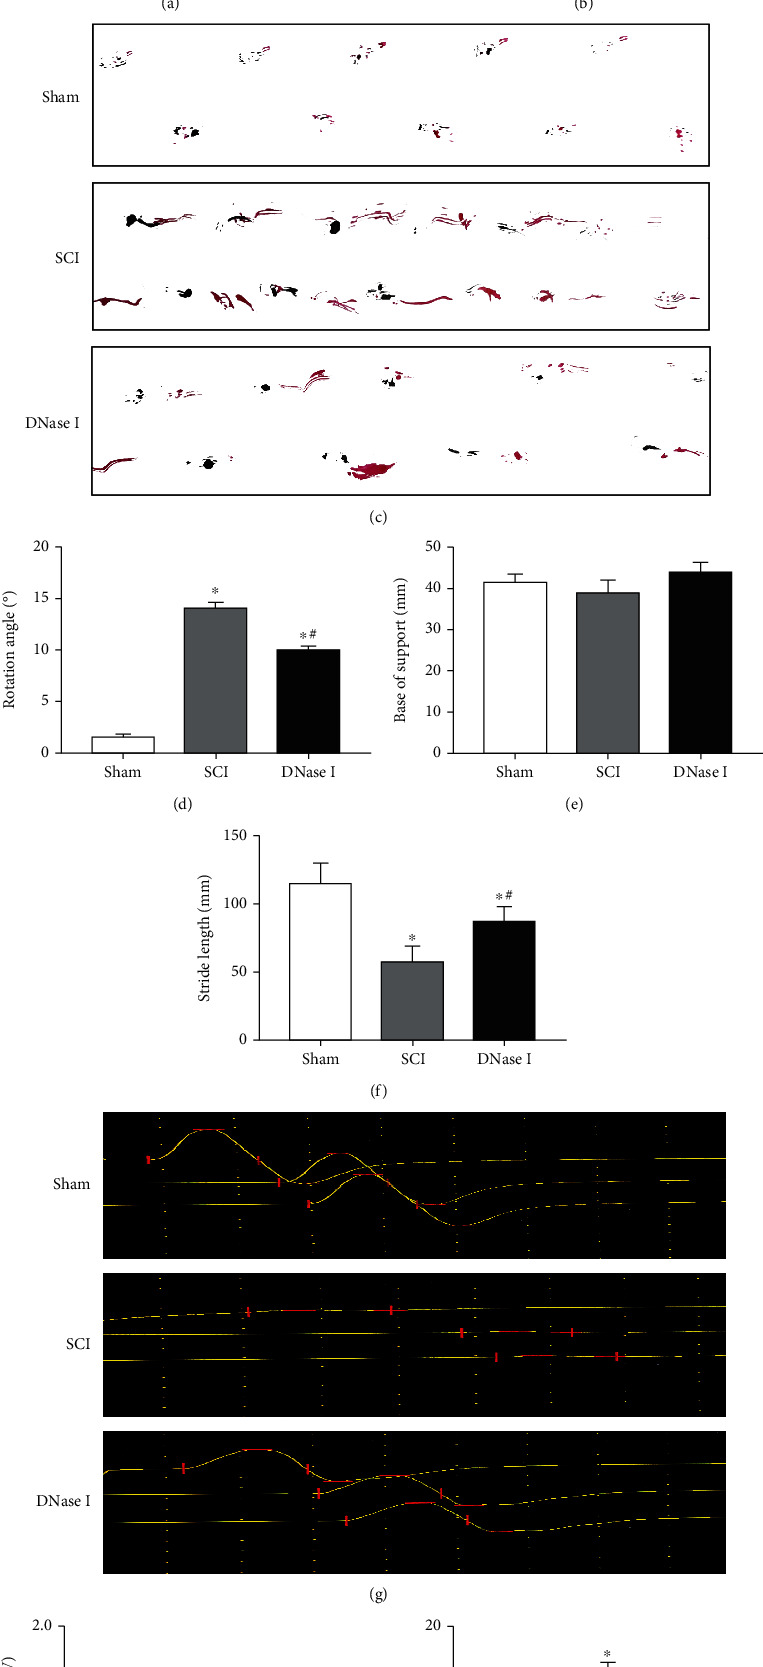
Limiting the number of Mets promotes the recovery of motor function and nerve conduction. (a) BBB scores of the Sham, SCI, and DNase I groups at 0, 7, 14, 21, and 28 days after the operation, respectively. Data are exhibited as Mean ± SD (n = 6). ∗P < 0.05 vs. Sham group; #P < 0.05 vs. SCI group (one-way analysis of variance followed by the least significant difference test). SCI: spinal cord injury; BBB scale: Basso-Beattie-Breshman Locomotor Rating Scale. (b) Inclined plane test results of the three groups at 0, 7, 14, 21, and 28 days after the operation, respectively. Data are displayed as Mean ± SD (n = 6). ∗P < 0.05 vs. Sham group; #P < 0.05 vs. SCI group. (c) Footprint map of three groups. (d–f) Representative bar graphs of rotation angle, the base of support, and stride length, respectively. Compared with those in the SCI group, the rotation angle and stride length in DNase I group were significantly improved. Data are shown as Mean ± SD (n = 6). ∗P < 0.05 vs. Sham group; #P < 0.05 vs. SCI group. (g) The waveform of MEP in Sham, SCI, and DNase I groups. Horizontal lines indicate the positions of peaks and troughs. The vertical lines split the periods of waves. (h–i) Typical bar graphs of MEP amplitude and latency in three groups, respectively. (h) The MEP amplitude in DNase I group is larger than the SCI group and similar to the Sham group. (i) The MEP latency in DNase I group is shorter than the SCI group and similar to the Sham group. Data are presented as Mean ± SD (n = 6). ∗P < 0.05 vs. Sham group; #P < 0.05 vs. SCI group. MEP: motor evoked potentials.
