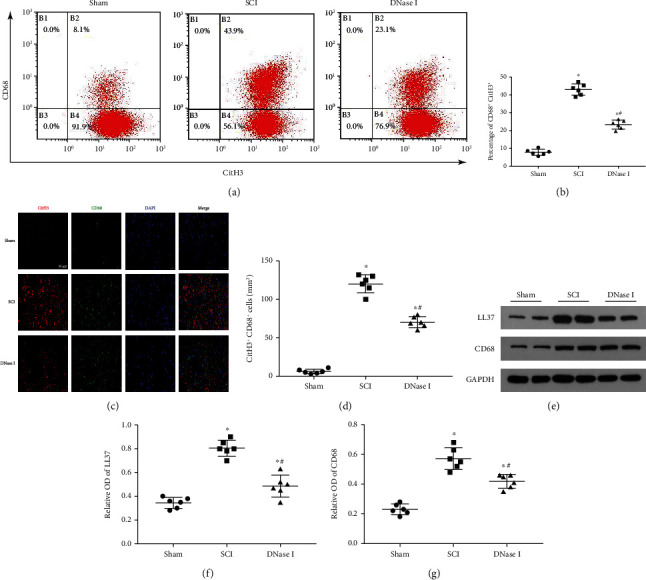
Figure 3.

Macrophages in the injured area produce Mets. (a) Representative flow plots show the relative cell composition labeled by CD68 and CitH3 in the injured area of each group 7 days after the operation. CitH3: Citrullinated Histone H3. (b) Scatterplot of the percentage of CitH3+ CD68+. The percentage of CitH3+ CD68+ in the DNase I group is lower than that in the SCI group but higher than that in the Sham group. Data are presented as Mean ± SD (n = 6). ∗P < 0.05 vs. Sham group; #P < 0.05 vs. SCI group. (c) Typical fluorescence staining images of CitH3 (red) and CD68 (green) double-positive cells in the injured area of each group at 7 days after the operation. Nuclear was labeled with DAPI (blue). Scale bar: 50 μm. (d) Scatterplot of the area of CitH3+ CD68+ cells in three groups. The percentage of the area of CitH3+ CD68+ cells in the DNase I group is lower than that in the SCI group but higher than that in the Sham group. Data are presented as Mean ± SD (n = 6). ∗P < 0.05 vs. Sham group; #P < 0.05 vs. SCI group. (e) Typical immunoblots of LL37 and CD68 in the injured area of each group at 7 days after the operation. GAPDH was used as a loading control. (f, g) Scatterplot of the relative OD of LL37 and CD68 in each group. The relative OD of LL37 and CD68 in the DNase I group is lower than that in the SCI group but higher than that in the Sham group. A comparison of relative OD of CD68 among three groups shows analogous results. Data are presented as Mean ± SD (n = 6). ∗P < 0.05 vs. Sham group; #P < 0.05 vs. SCI group. OD: Optical Density.
