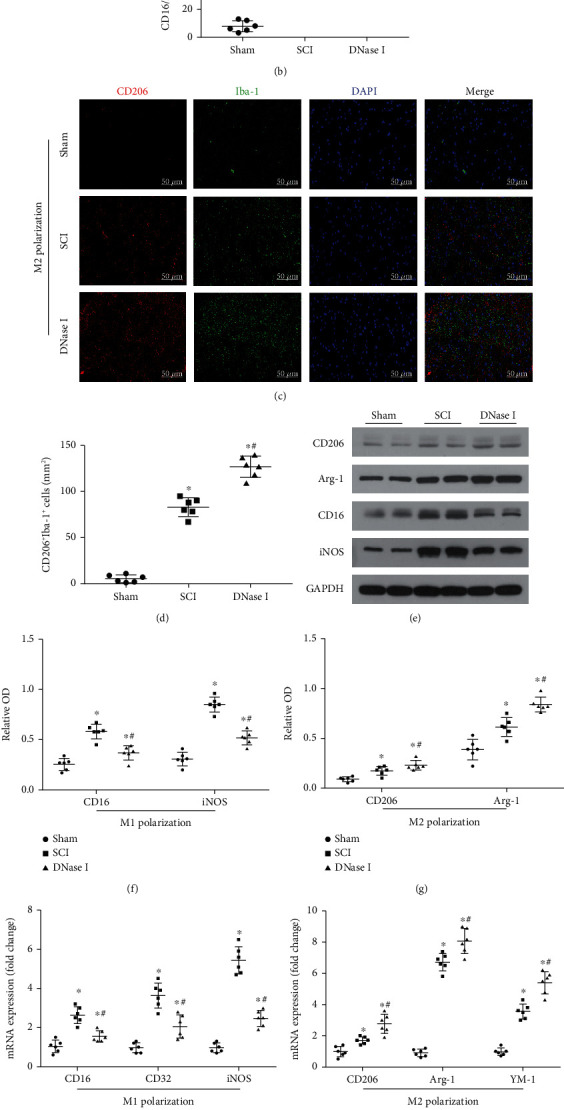
Figure 4.

Limiting the number of Mets promotes M2 polarization of macrophage/microglia in the injured area. (a) Representative fluorescence staining images of CD16/32 (red) and Iba-1 (green) double-positive cells in the injured area of each group at 7 days after the operation. Nuclear (blue). Scale bar: 50 μm. (b) Scatterplot of the area of CD16/32+ Iba-1+ cells in each group. The area in DNase I group is lower than that in the SCI group but higher than that in the Sham group. (c) Typical images of CD206 (red) and Iba-1 (green) double-positive cells in the injured area of each group at 7 days after the operation. Scale bar: 50 μm. (d) Scatterplot of the area of CD206+ Iba-1+ cells in each group. The comparison results of the area of the three groups are the same as b. (e) Representative immunoblots of CD206, Arg-1, CD16, and iNOS in the injured area of each group at 7 days after the operation. (f) Scatterplot of the relative OD of CD16 and iNOS in each group. The relative OD of CD16 and iNOS in the DNase I group is lower than that in the SCI group but higher than that in the Sham group. (g) Scatterplot of the relative OD of CD206 and Arg-1 in each group. The relative OD of CD206 and Arg-1 in the DNase I group is considerably higher than that in the SCI group. (h) Scatterplot of CD16, CD32, and iNOS mRNA expression in each group using RT-qPCR. RT-qPCR: Real Time-quantitative PCR. (i) Scatterplot of CD206, Arg-1, and YM-1 mRNA expression in each group. (j) Scatterplot of the cytokine concentrations of IL-1β and IL-10 in each group. Data from all the above scatterplots are presented as Mean ± SD (n = 6). ∗P < 0.05 vs. Sham group; #P < 0.05 vs. SCI group (one-way analysis of variance followed by the least significant difference test).
