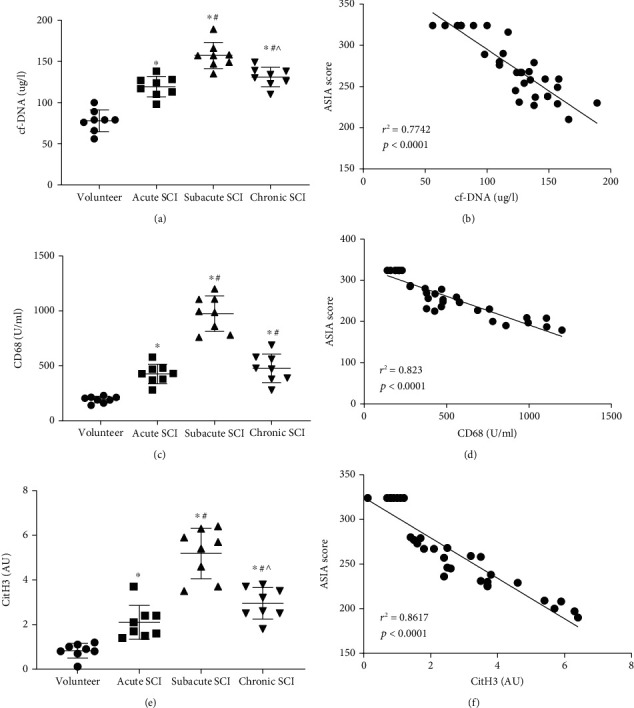
Figure 6.

The concentrations of Mets-associated proteins in human serum can be used to evaluate SCI. Scatterplot of the concentrations of cf-DNA, CD68, and CitH3 in serum of healthy volunteers and patients at different SCI stages. Data are presented as Mean ± SD (n = 6). ∗P < 0.05 vs. volunteer group; #P < 0.05 vs. acute SCI group; ∧P < 0.05 vs. subacute SCI group (one-way analysis of variance followed by the least significant difference test) (a, c, e). Linear regression analysis between ASIA score and the concentrations of cf-DNA, CD68, and CitH3 in serum of all subjects, respectively (b, d, f).r2 is the coefficient of determination. The value range of r2 is 0 to 1. P < 0.001 means a linear regression relationship between the X and Y variable.
