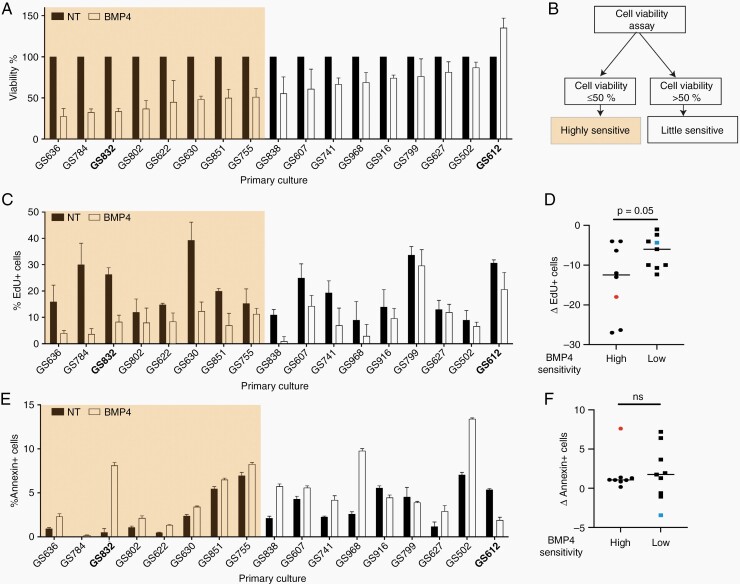
Fig. 1.
Cell viability after treatment with BMP4. (A) Average cell viability with standard deviation 7 days post-treatment with 60 ng BMP4/ml normalized to untreated (NT) cells (n = 3). Cultures used for single-cell analysis are in bold. (B) Flow-chart of stratification into the ‘highly sensitive or the “little sensitive” cultures. (C) Mean percentage with standard deviation of EdU-positive (EdU+) cells after 2 days of 60 ng BMP/ml (n = 3). (D) Mean difference in EdU+ cells after treatment with BMP4. (F) Mean percentage with standard deviation of Annexin-V+ cells after 4 days of 60 ng BMP4/ml (n = 3). (G) Mean difference of Annexin+ cells after treatment. ns = Not-significant. In E and F, the orange and blue square indicate single-cell sequenced tumors GS832 and GS612.

