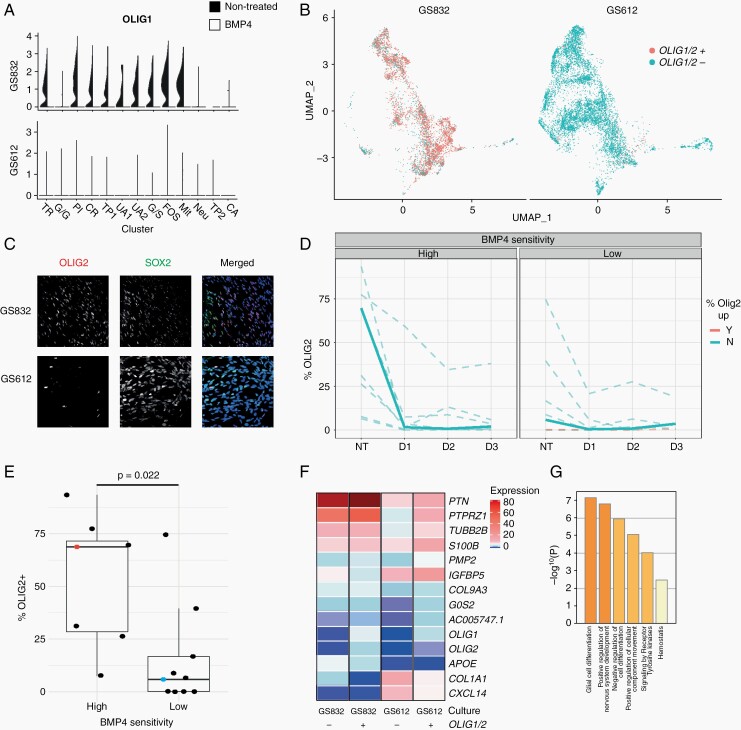
Fig. 5.
OLIG1/2 predicts in vitro therapeutic efficacy of BMP4. (A) Violin plots depicting mean and variance of oligodendroglial lineage markers in highly BMP4-sensitive GS832 (top) and little-sensitive GS612 (bottom). The black side represents the non-treated, and the white side the BMP4-treated cultures. (B) UMAP of untreated cells discriminated based on scaled OLIG1 or OLIG2 (≥0.75 red; <0.75 blue) expression of cultures GS832 (left) and GS612 (right). (C) Representative images of untreated cultures stained for OLIG2 (red), SOX2 (green) and DAPI (blue). (D) Percentage of SOX2+ cells. NT (untreated), D1 (day 1), D2 (day 2), D3 (day 3). The bold lines represent GS832 (high-sensitivity) and GS612 (low-sensitivity). Loss of OLIG2+ cells after 3 days of BMP4 is colored blue, and gain red. (E) Percentage of OLIG2+ cells expressing related to dichotomized (viability <50% after 7 days of BMP4) sensitivity. (F) Scaled expression of differentially expressed genes between OLIG1/2+ and OLIG1/2- cells. (G) Overrepresented gene ontologies in differentially expressed genes mentioned in (F).

