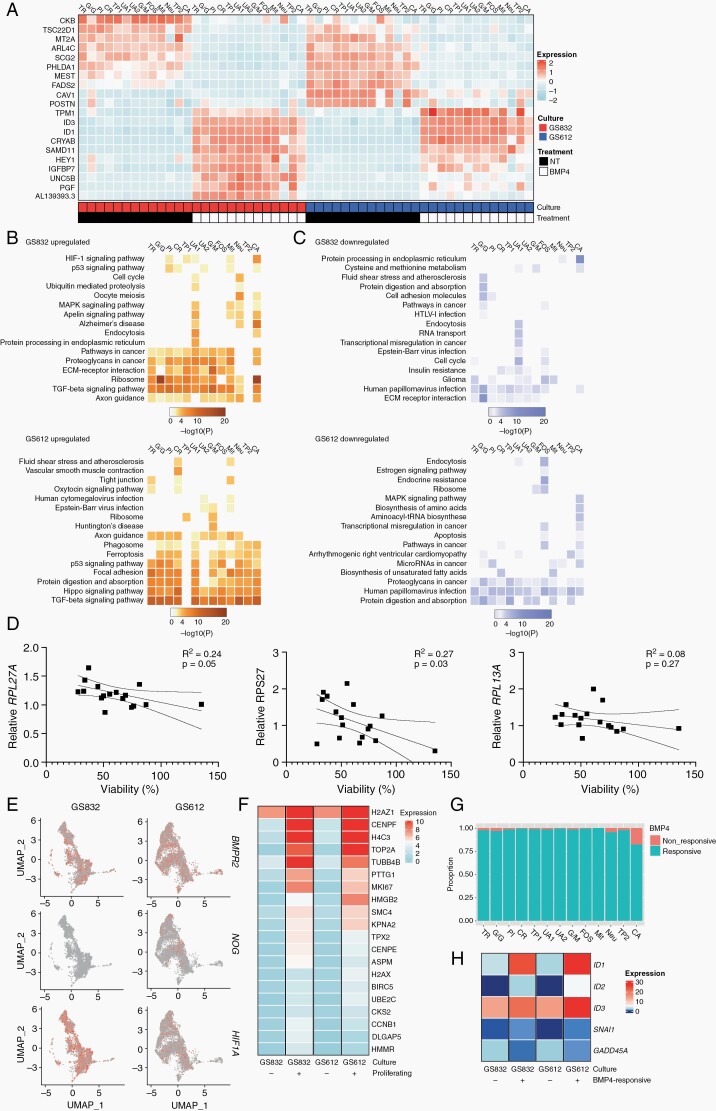
Fig. 6.
Subpopulation-specific responses to treatment with BMP4. (A) Expression of the 10 most differentially expressed genes after treatment with BMP4 in GS832 (red) and GS612 (blue). NT = untreated. Heatmap of enriched KEGG pathways for upregulated (B) and downregulated (C) genes after treatment with BMP4 in GS832 (top panel) and GS612 (bottom panel). (D) Correlation with standard deviation of mean relative expression of ribosomal translation genes after 24 h treatment with BMP4 normalized to GAPDH and relative to untreated cells, compared to viability after 7 days of treatment with BMP4 (n = 3). (E) Top-20 differentially expressed genes in proliferating vs non-proliferating cells after BMP4. (F) Proportion of cells per cluster that do not upregulate ID1 and ID2 (non-responsive) vs those that do (responsive) after BMP4. (G) Heatmap illustrating the anti-correlation of GADD45A with ID1 and ID2. (H) Expression of BMPR2, NOG and HIG1A in untreated cultures GS832 and GS612.

