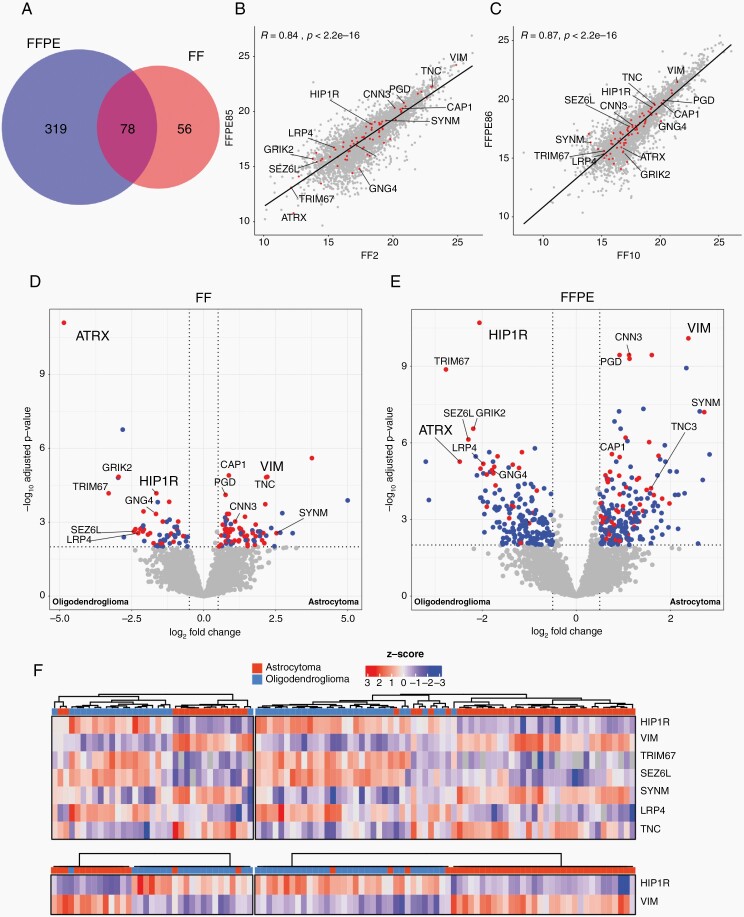
Fig. 1.
Differential protein abundance analysis of astrocytoma and oligodendroglioma. (A) Venn diagramm depicting number of significantly DAP in FF and FFPE tissue. Overlap shows the number of proteins which were significantly different in both cohorts. Pearson correlation analyses between a matched pair of FF and FFPE of an astrocytoma (B) and an oligodendroglioma (C). Volcano plot of significantly differentially expressed proteins (DAP) between astrocytoma and oligodendroglioma in FF (D) and FFPE (E) tissue. Blue dots represent proteins which were found either in the FF or FFPE tissues exclusively, red dots represent proteins which were found consistently in both cohorts. Dashed lines represent threshold for significance (P-value <.01) and log2 fold change (1,5). (F): Hierarchical clustering of the FF (left) and FFPE (right) cohort using a subset of DAP (top) and HIP1R and VIM (bottom) between astrocytoma and oligodendroglioma.

